

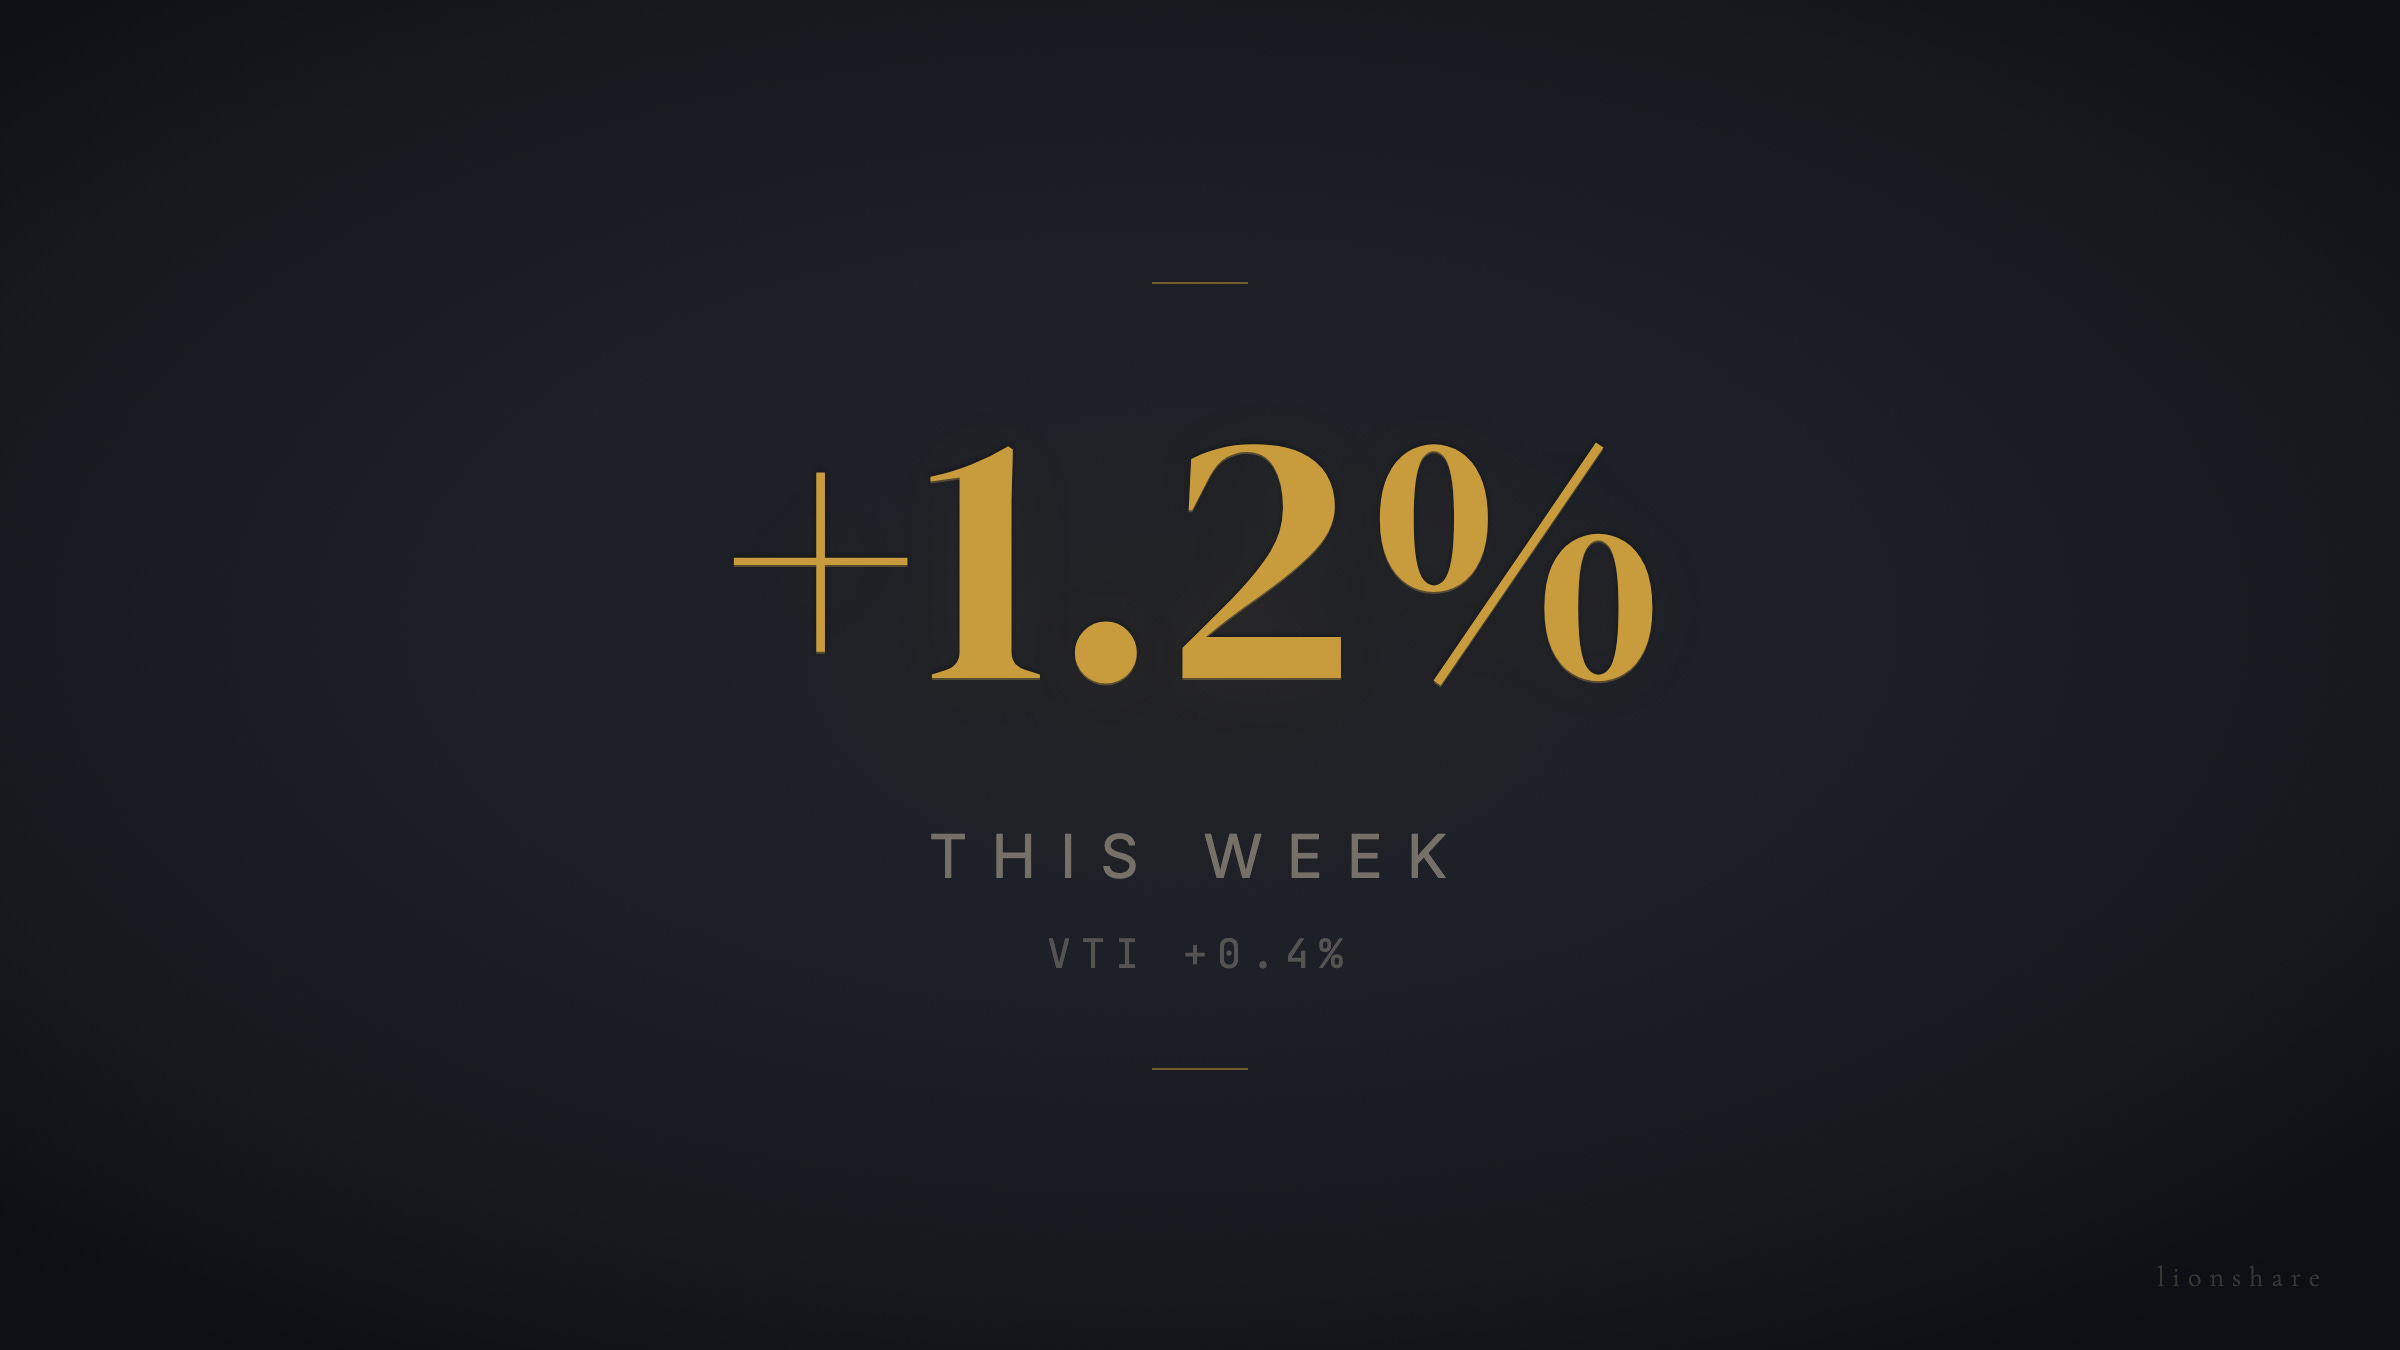
Every week I close the loop on the recent performance. Wins and losses get reported the same way. The live record on Dub is the source of truth.
The scorecard
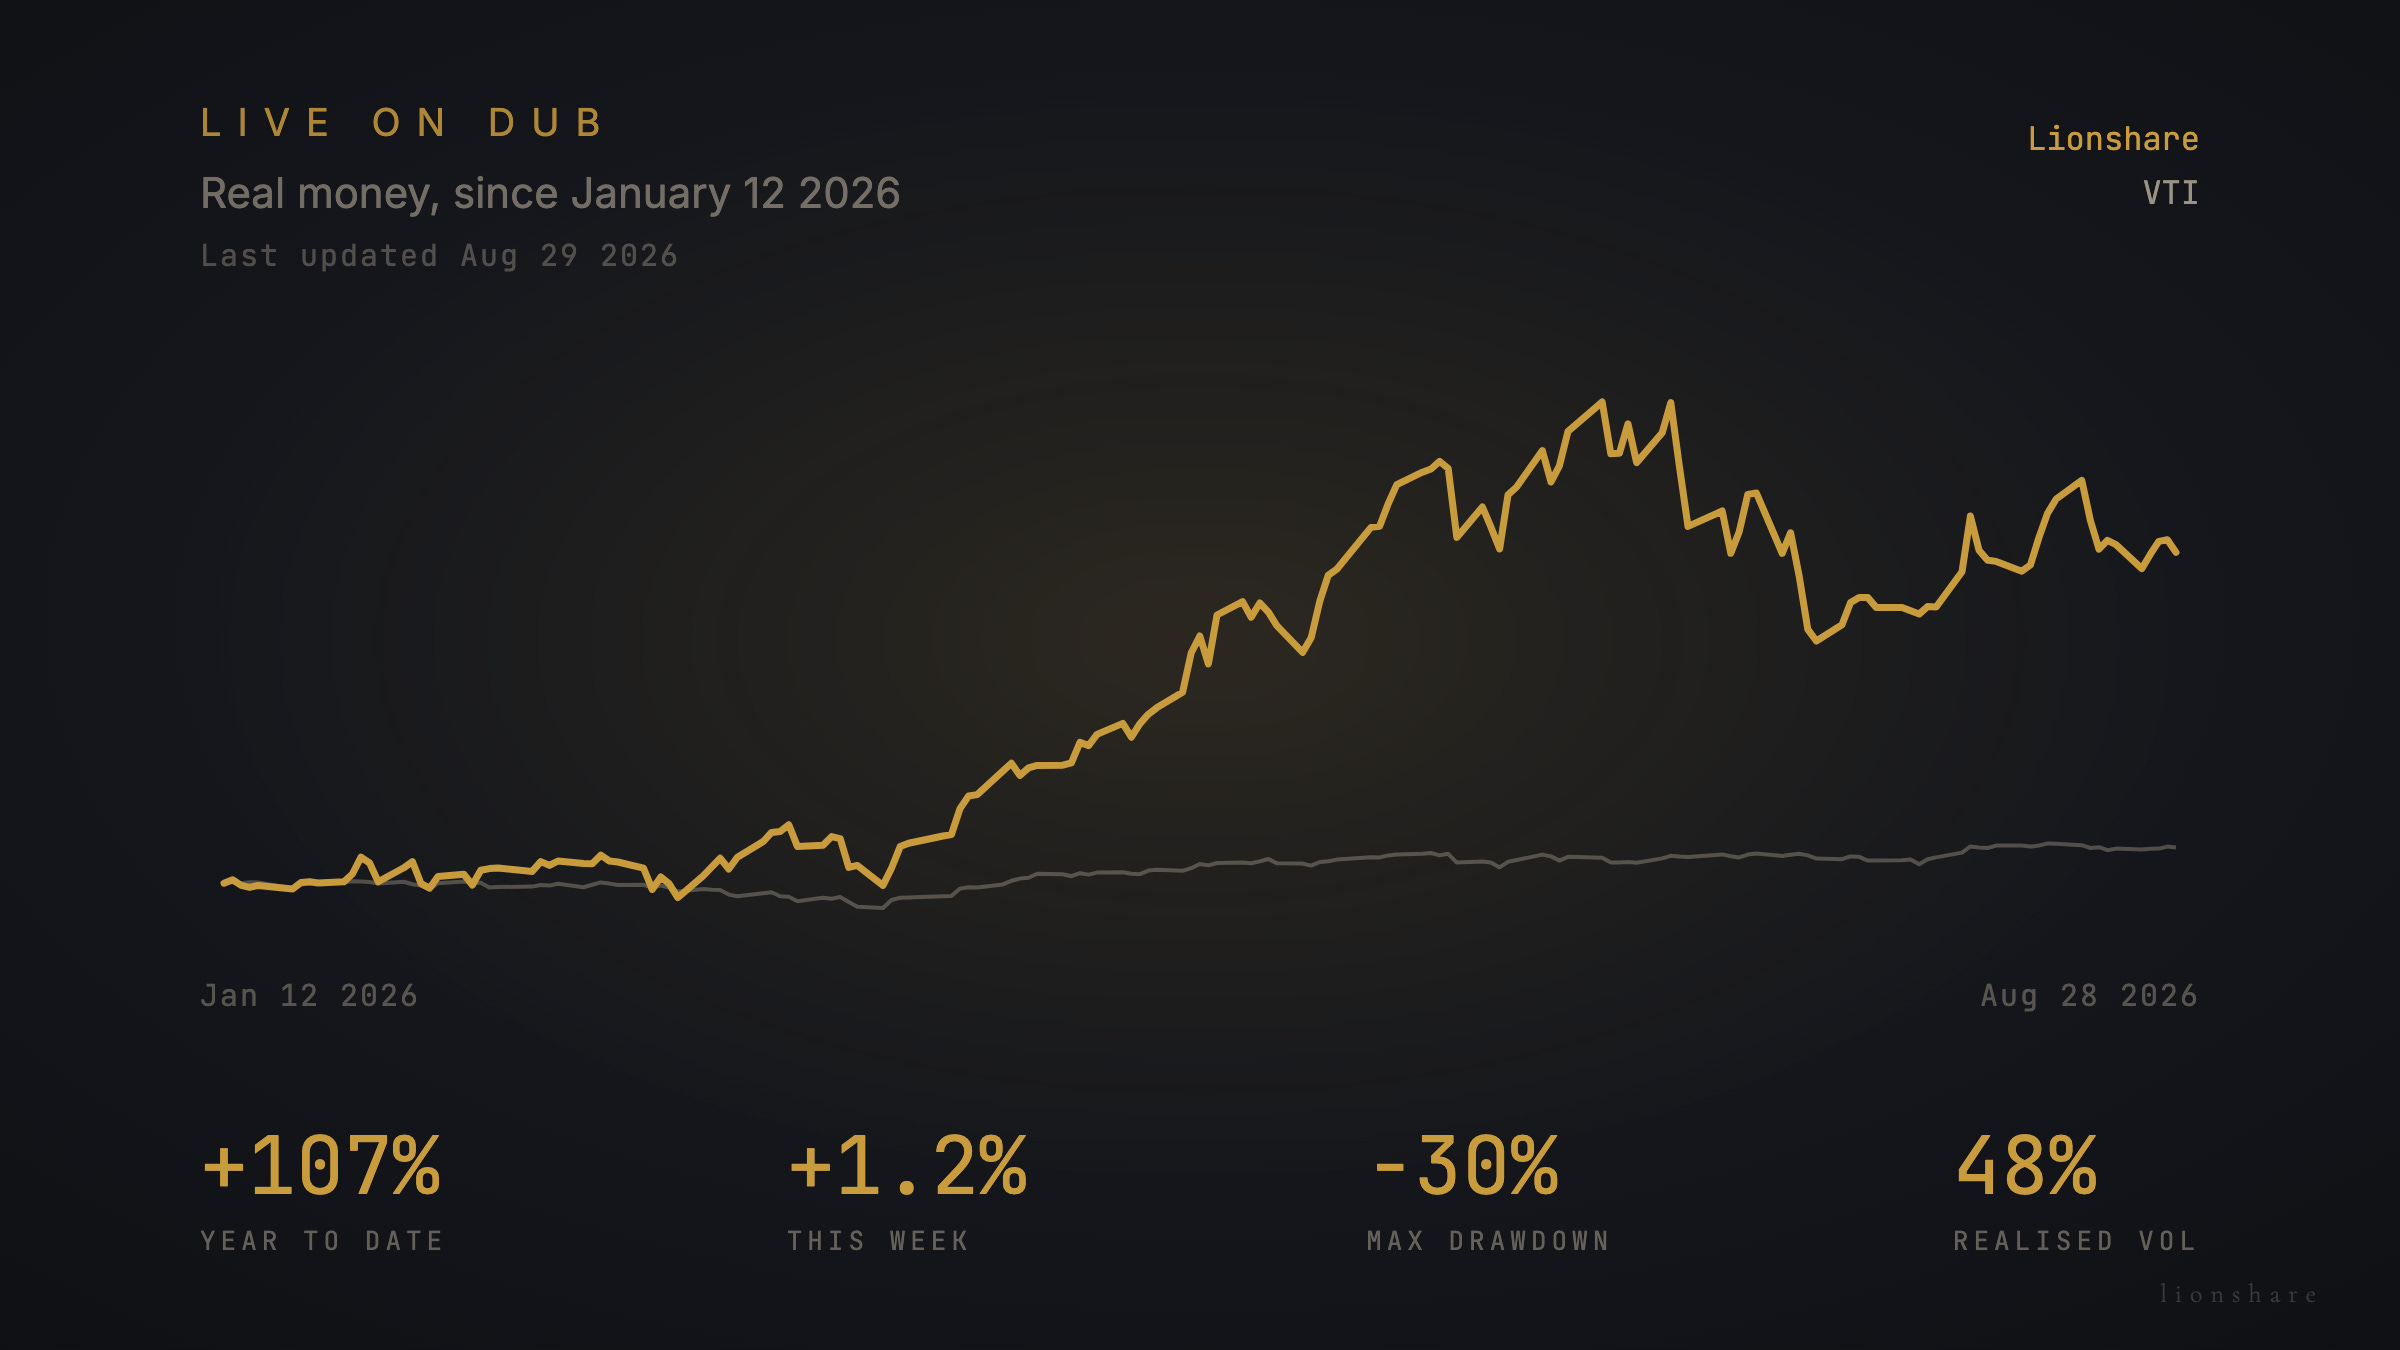
The trend:
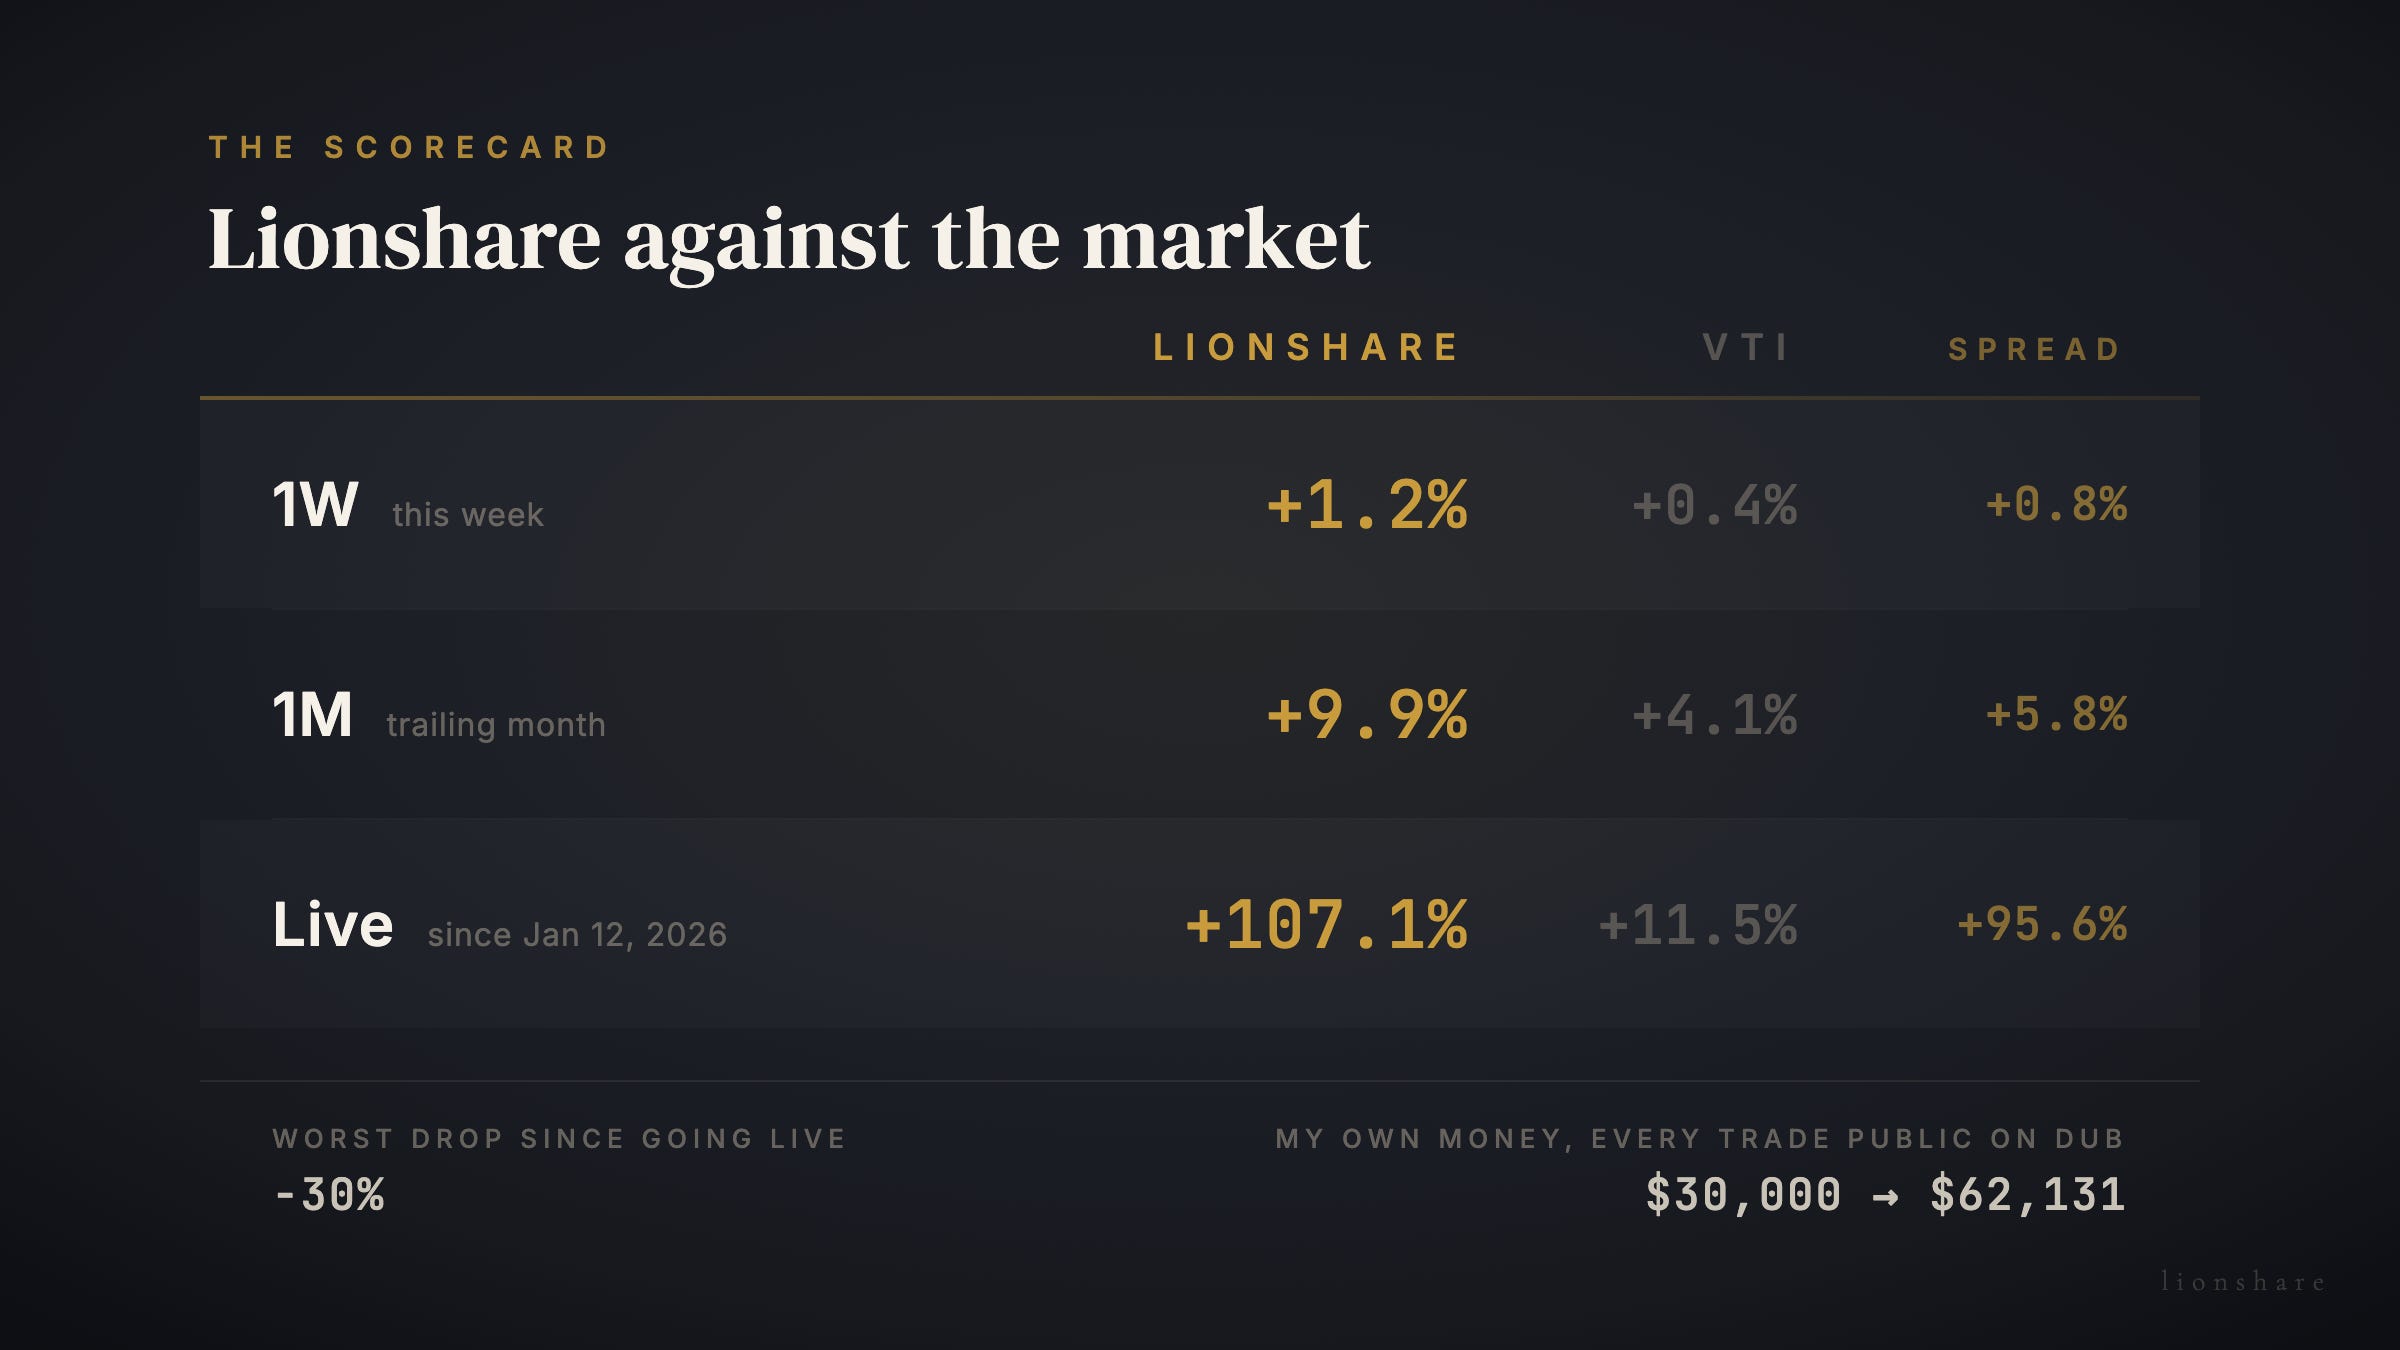
By period:
Everything in the scorecard above is live, real money I have traded publicly since January 12, 2026. Before a dollar went in, the system was tested on six years of market data. Every trade since has been public, so you can check the whole record before you trust a word of it.
Verify every trade on Dub: here
Learn more about the system: here
Read the backtest details: here
What happened this week
The week ended at +1.2%, against the broad market at +0.4%.
Three of the ten positions finished higher and seven finished lower, which normally reads as a red week. It didn’t this time, because the three that rose were the ones holding most of the money, the strongest gaining +6.8%, another +4.1%, and the largest holding +2.9%. Of the seven that fell, the steepest went -6.8% and the next -4.1%, with the other five landing between -0.2% and -3.1%. Average the ten moves and you get about -0.4%, so the gap between that and +1.2% comes down to which names were carrying the weight. Last week the same arithmetic ran against me. By Thursday the week stood at +3.2%, then Friday came in at -1.8% and took most of that back, so what the scorecard shows as a quiet week ran noisier day to day.
The record on Dub now stands at $62,131 from the $30,000 it started with, +$749 for the week, seven and a half months in.
Next Monday
Everything above is free, and every trade behind it is public on Dub. On Monday the system scores around two thousand US stocks again and sets the portfolio for the week.
Paid subscribers get the full list before the market opens, every position with its exact weight and its stop, the same one I place with my own money that morning.
That list is the part you act on.
Found this useful? Like it, restack it, or send it to one person who’d want it too.