
How I backtested the stock strategy I run with my own money
Six years through the 2020 crash and the 2022 bear, the three ways I tried to break it, and the live record on Dub.
The results. $50,000 to $1.6 million in six years
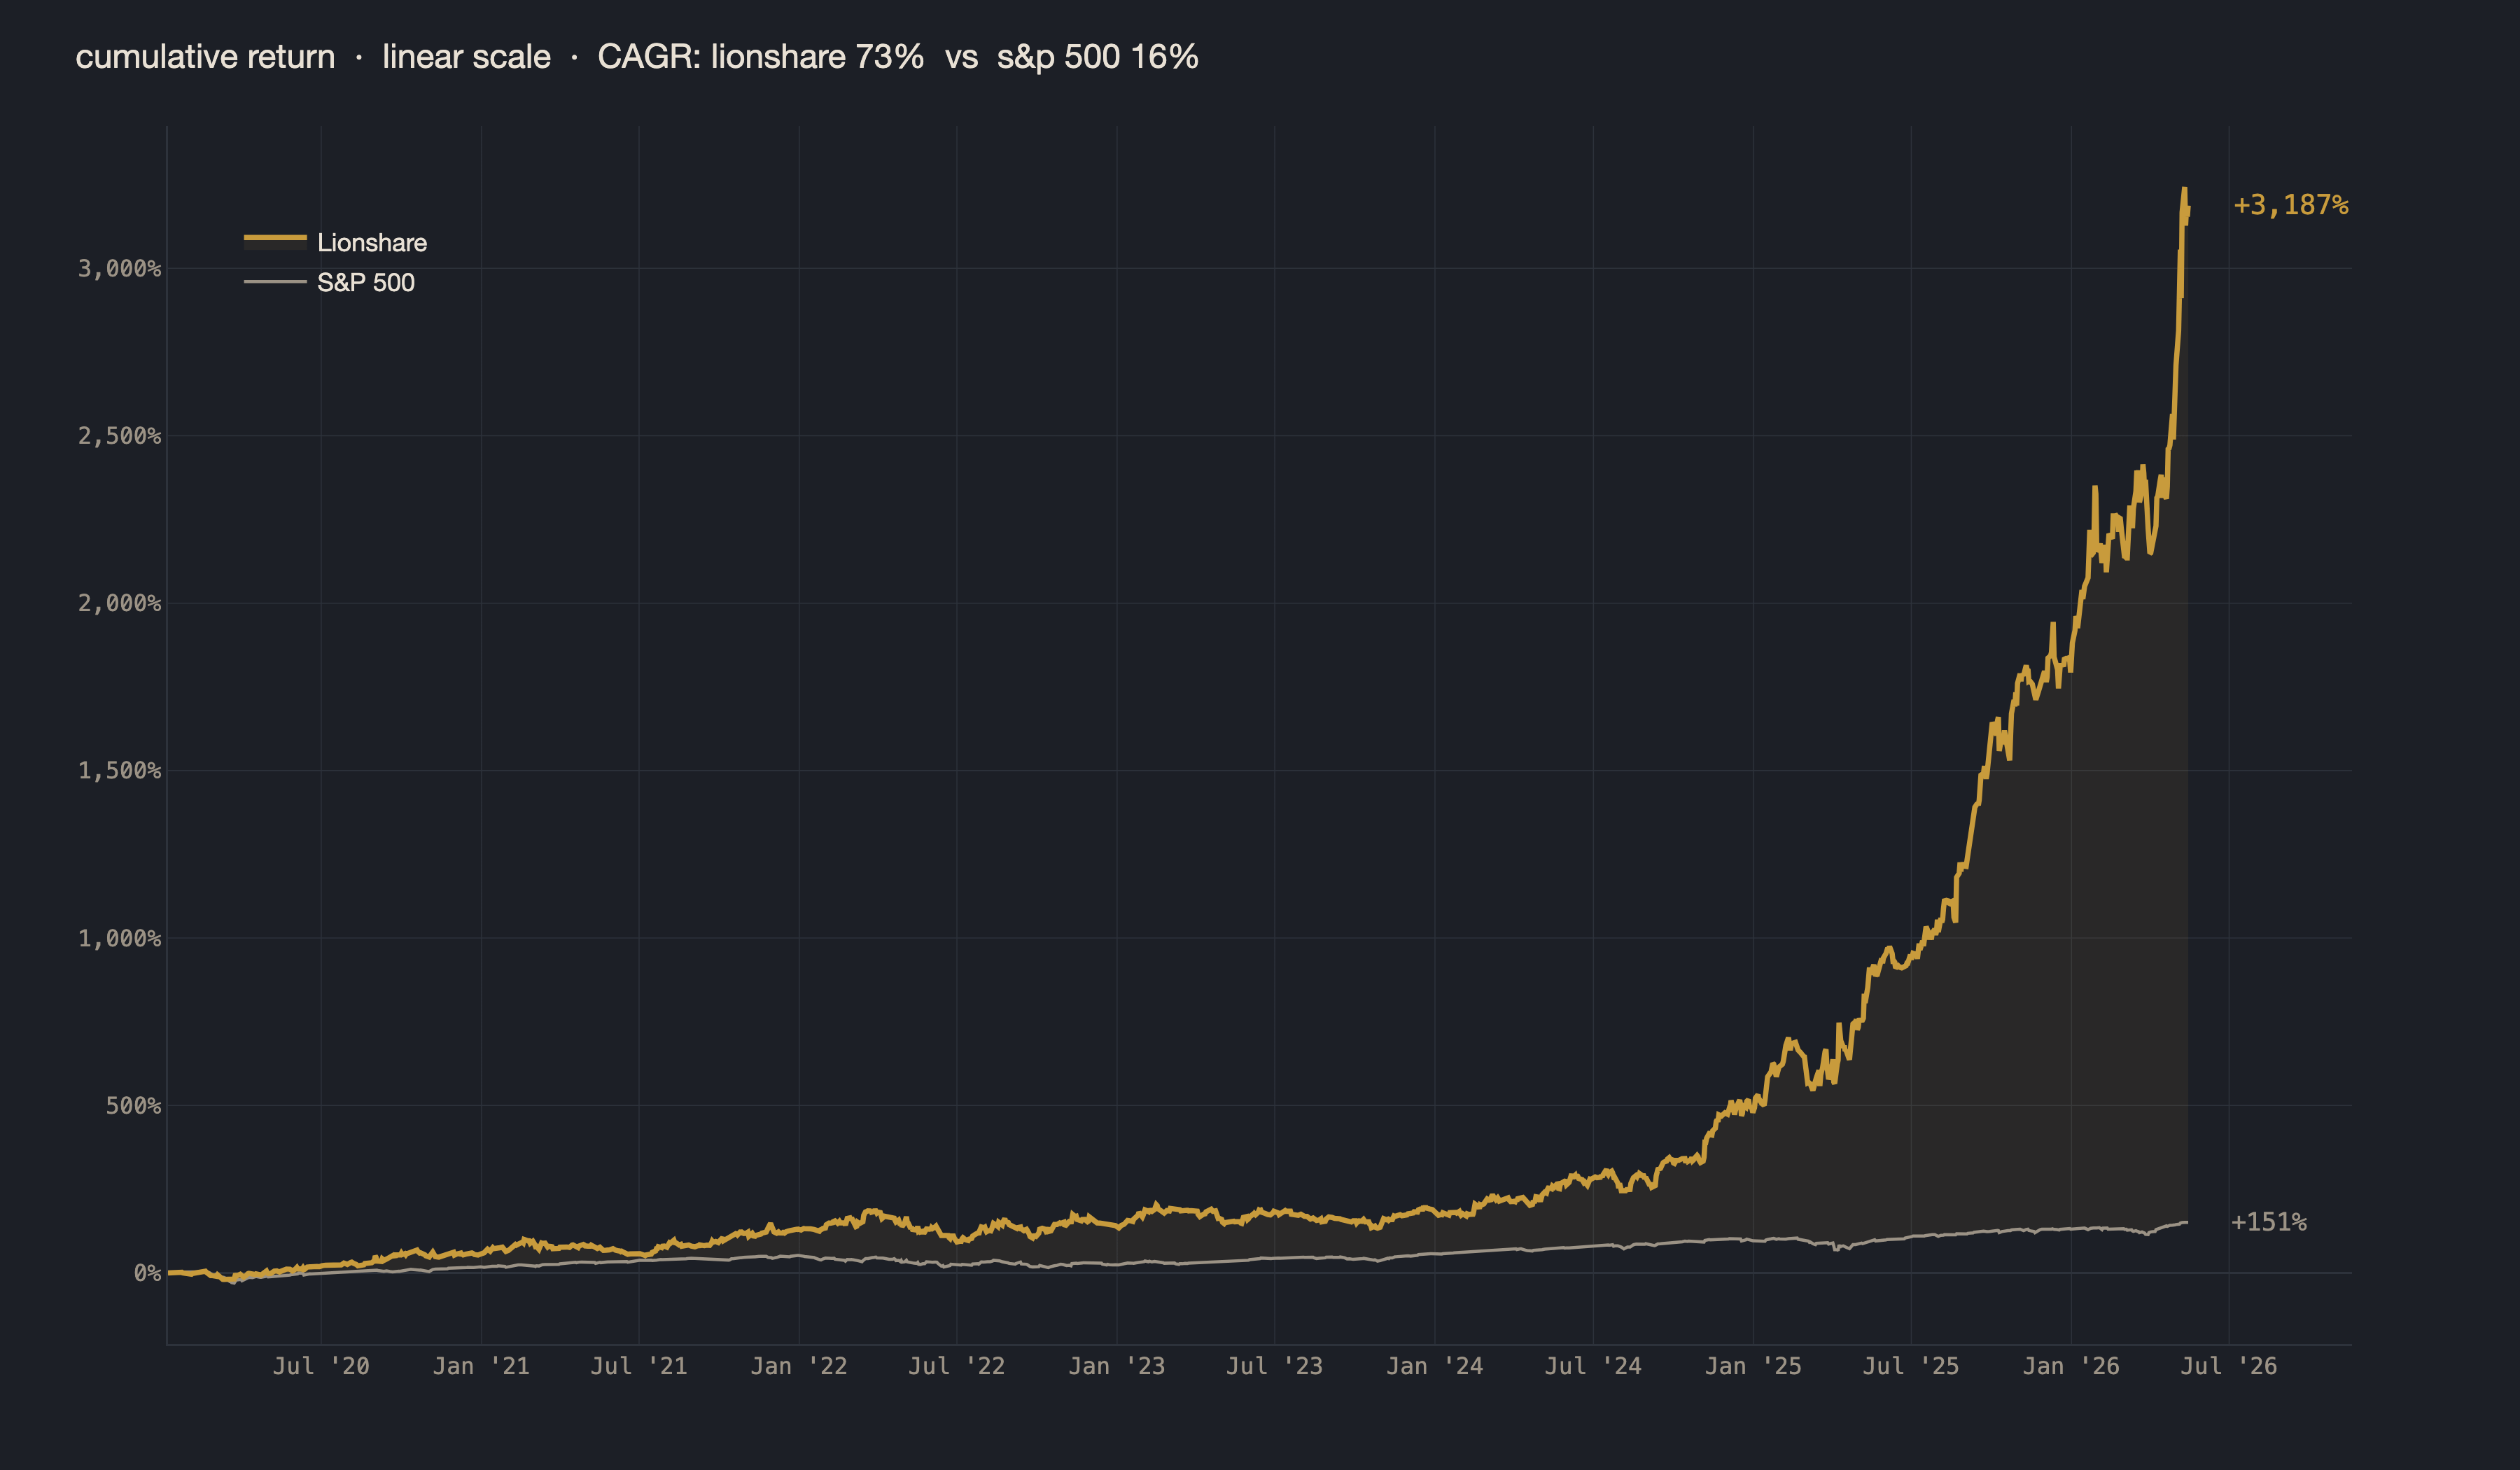
The first chart covers six years and four months. January 2020 through May 2026. The orange line is Lionshare. The line tracking along the bottom is the S&P 500.
Three numbers from that chart.
+3,100% cumulative return since January 2020, against the S&P 500’s +151%
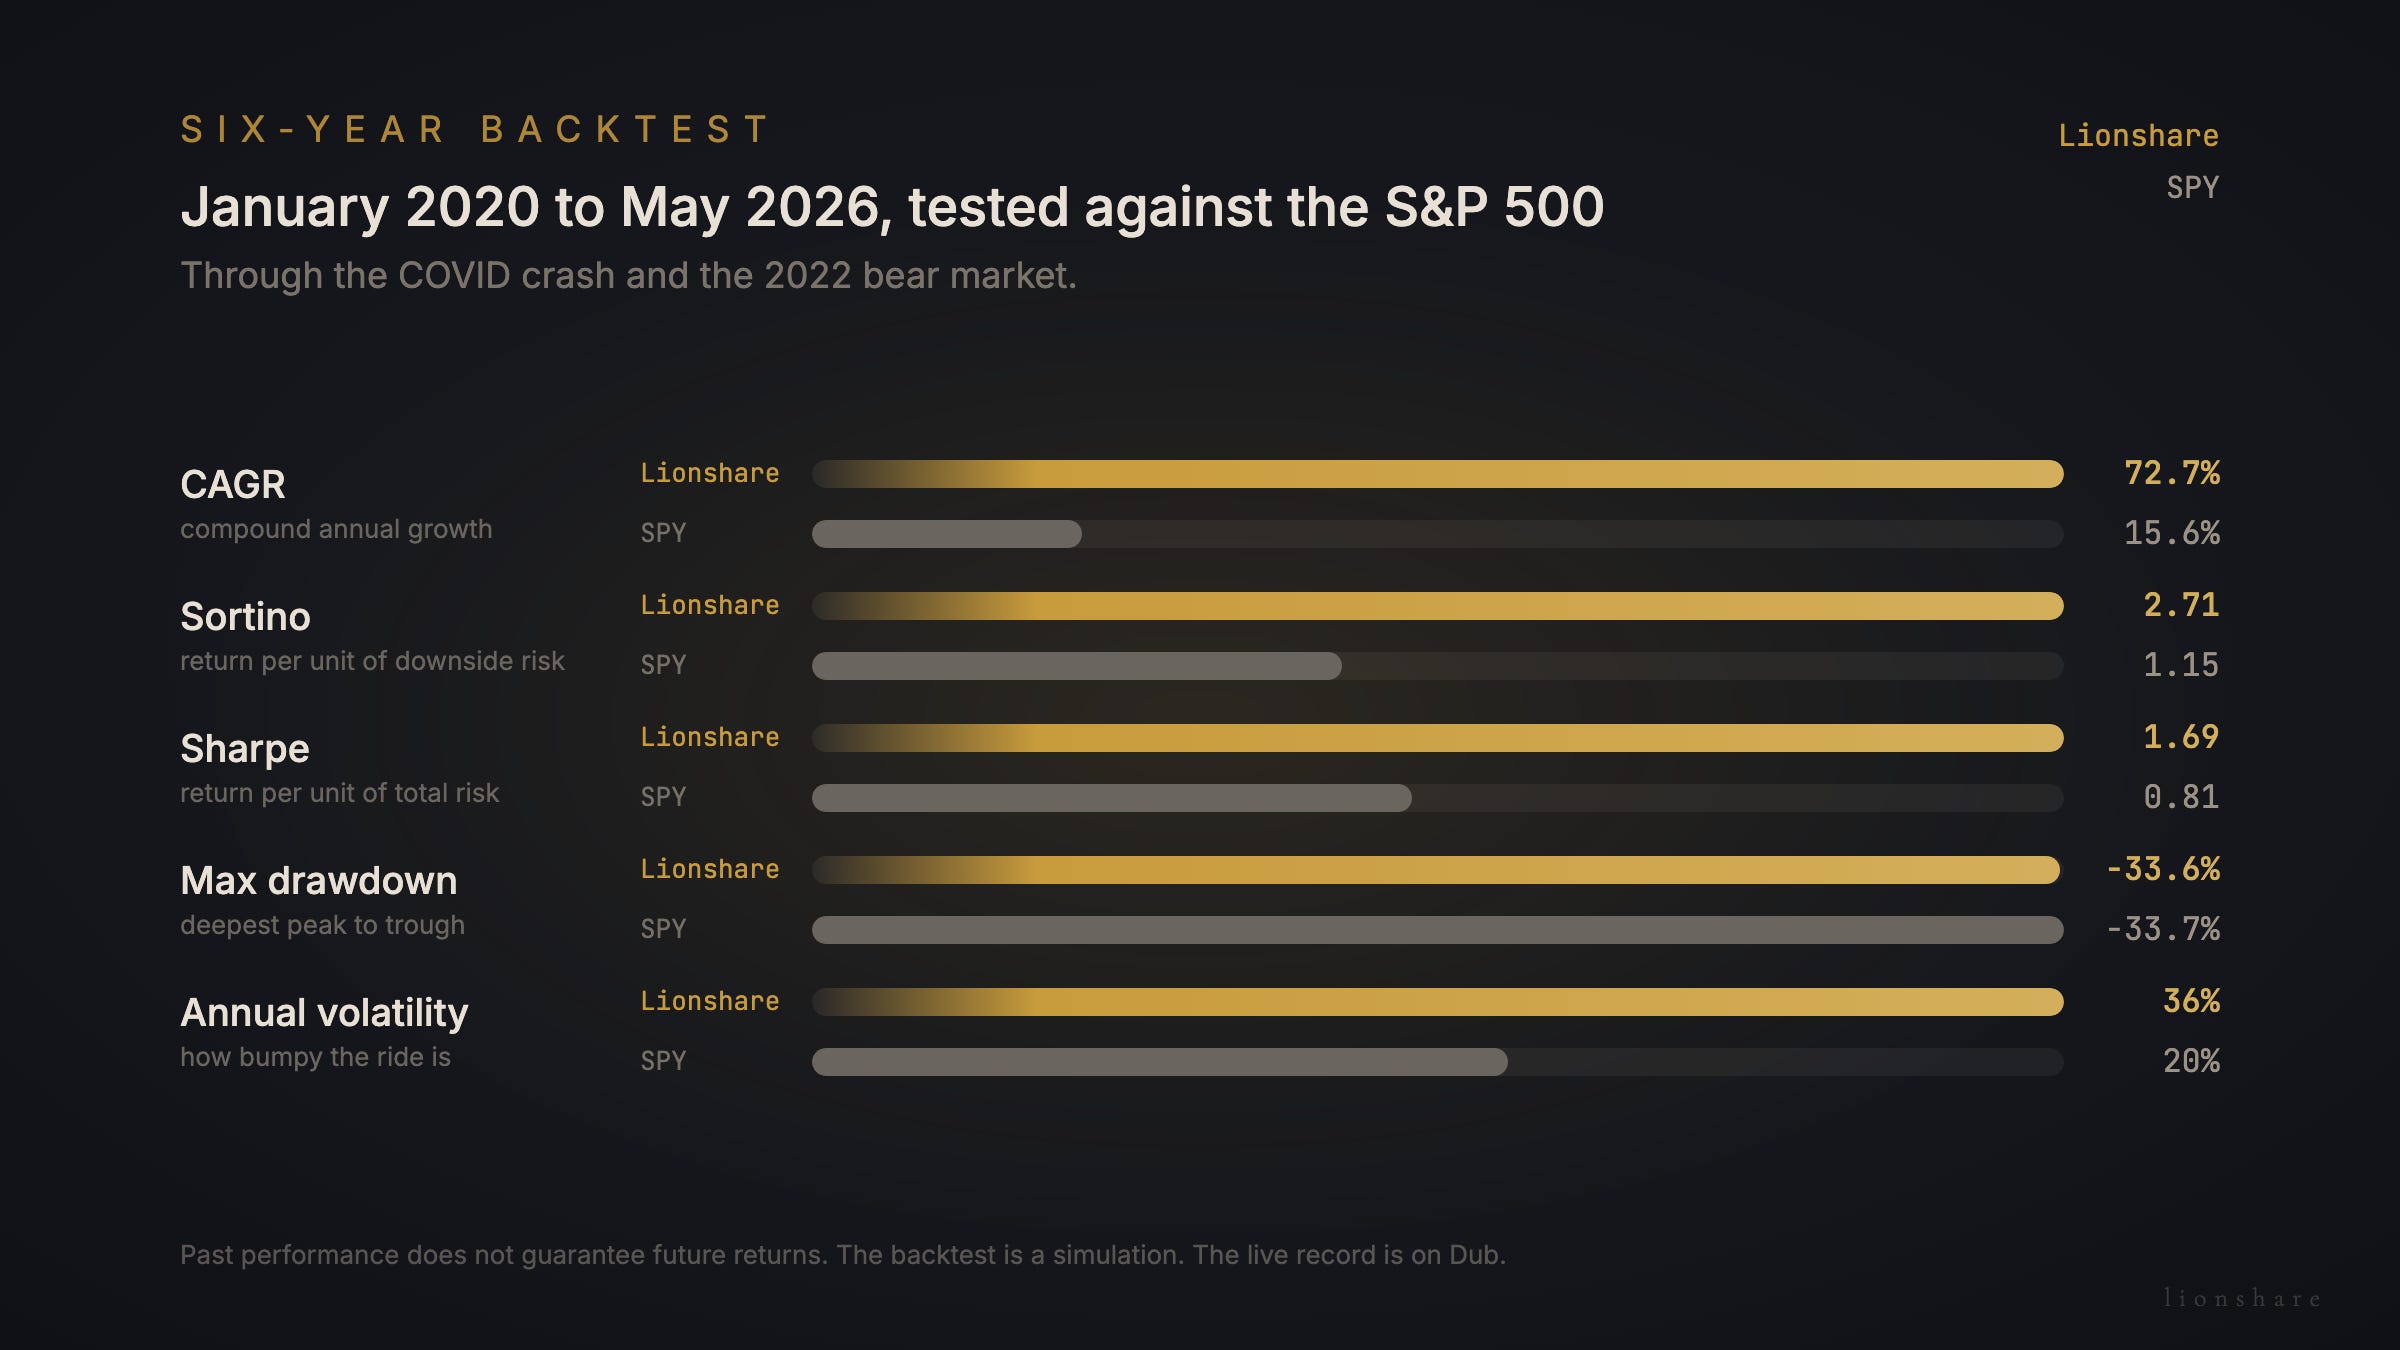
72.7% compounded annual growth rate, against the market’s 15.6%
Sortino ratio of 2.71, a measure of return earned per unit of downside risk.
To put that in dollar terms rather than percentages. $50,000 invested in the strategy in January 2020 would be worth roughly $1.6 million today. The same $50,000 in an S&P 500 ETF would be worth about $125,000. I use $50,000 here because it crosses the seven-figure mark inside the backtest window, which makes the scale of the difference easier to feel than a percentage alone.
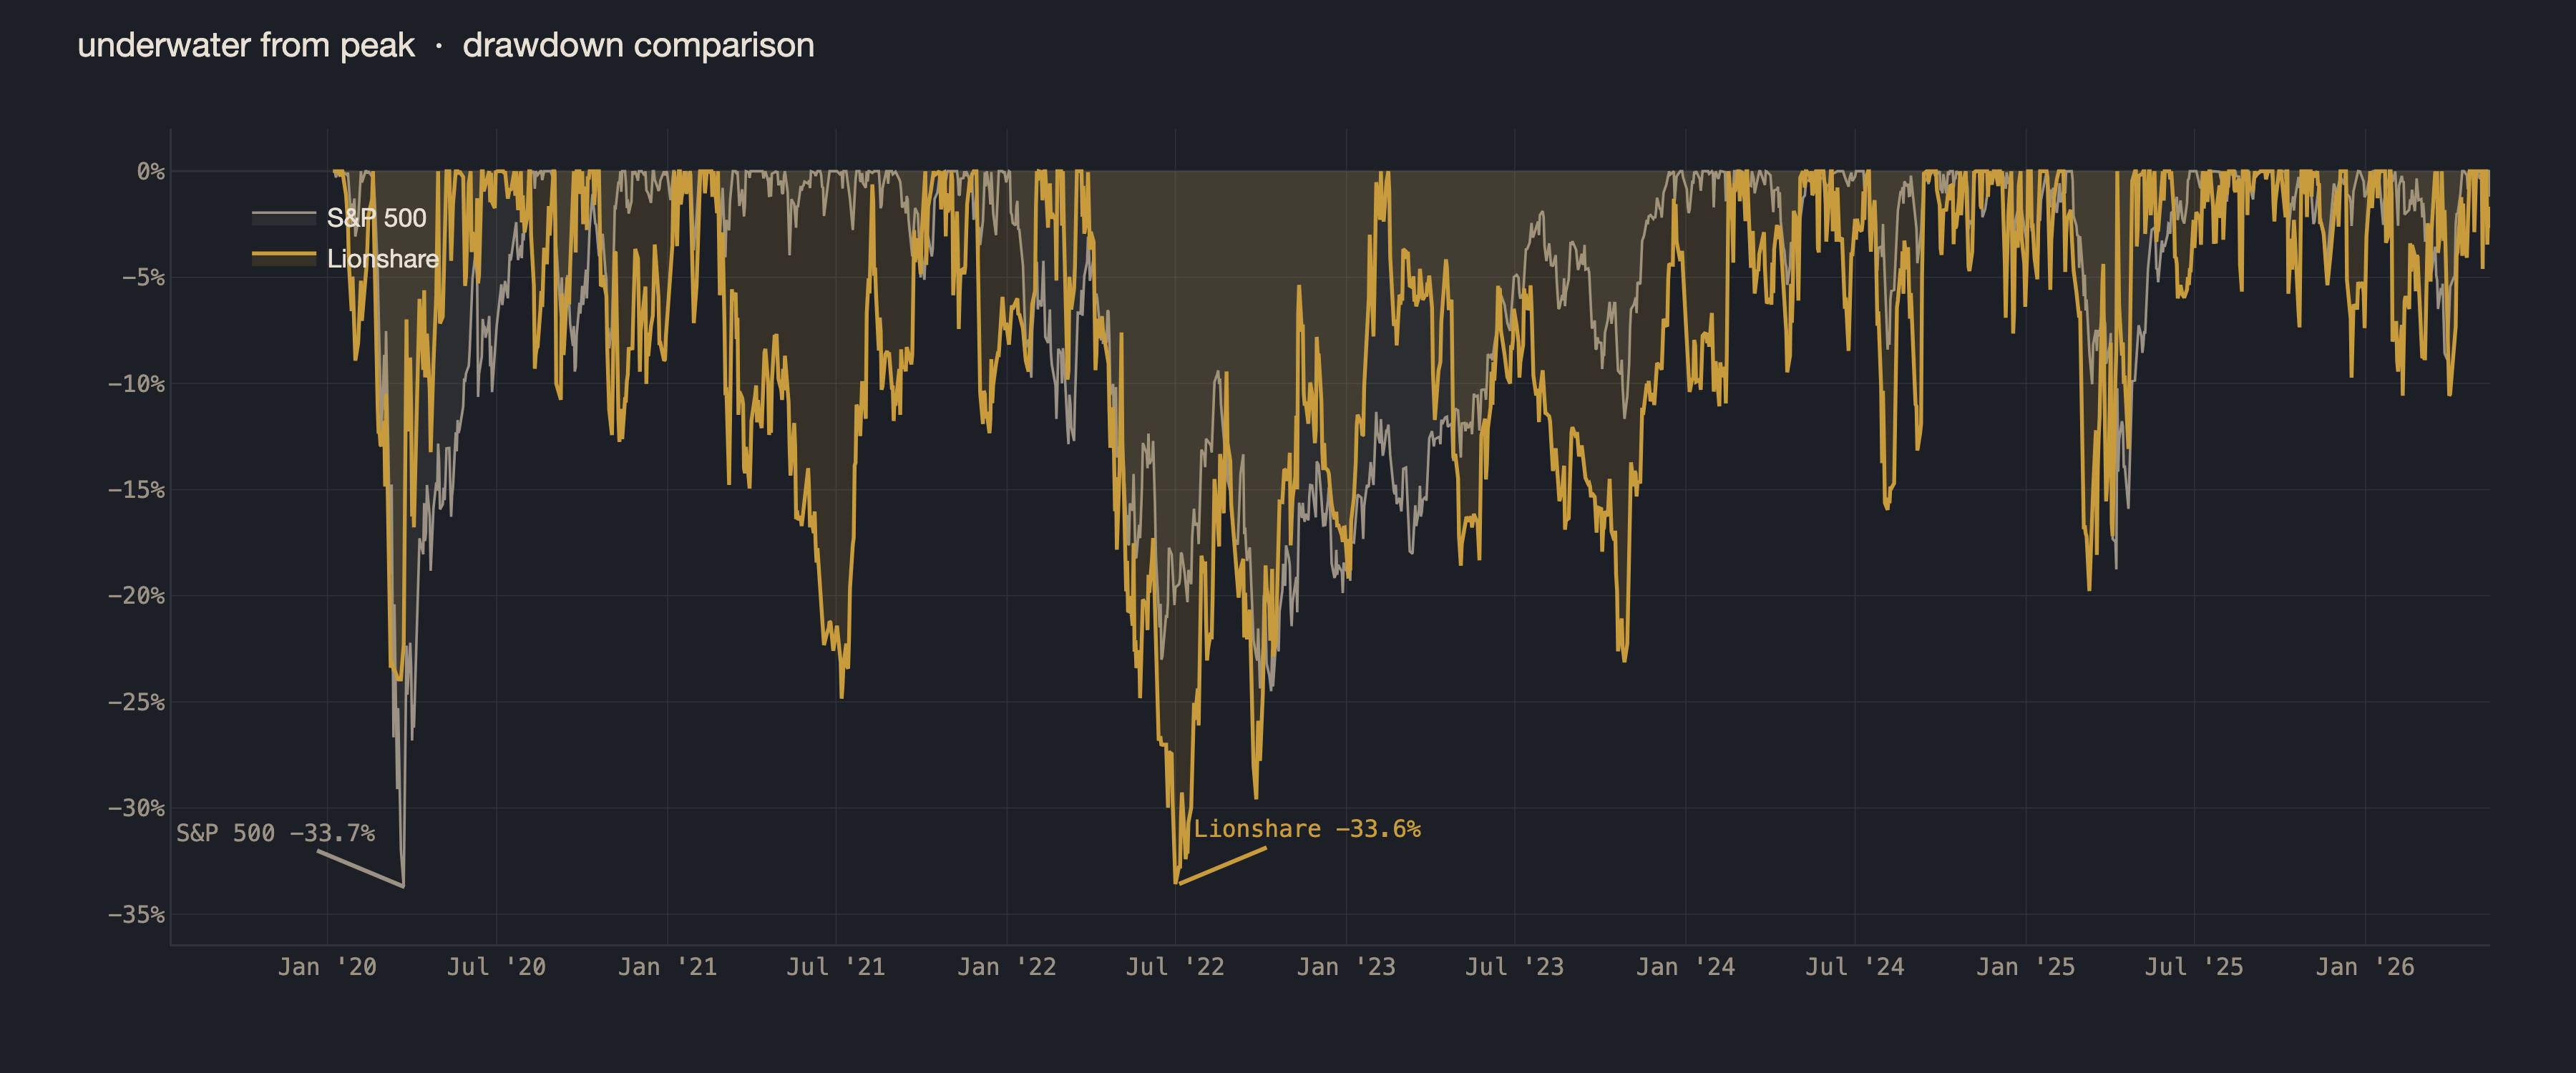
The second chart is the cost of that climb. How far each strategy fell from its high, and how long it stayed down. The worst stretch is in there from the start, in the open, and we come back to it in detail later. I would rather you see the pain on the same screen as the gain.
One question worth answering up front. Why does the test start in January 2020 and not earlier? Two reasons.
The institutional-grade data the algorithm consumes, fundamentals, analyst signals, and pricing across the two thousand-plus stocks I screen each week, is only consistently available back to that point. Testing on thinner, less reliable data is one of the easiest ways in the world to fool yourself.
The window is wide on purpose. It covers the COVID crash and recovery, the 2021 bull run, the 2022 bear, the choppy 2023, the 2024 to 2025 AI ramp, and the 2026 reset. Every regime a long-running strategy is supposed to handle, in one window.
A return that large invites one fair question is if it’s real, or is it the usual backtest mirage? The rest of this post is the answer. How I tried to break it, what it cost in the worst stretch, and the things I am not going to claim about it.
The numbers that explain the strategy
The headline numbers above are meaningless without context. Three more are worth understanding before going further, because together they explain how the strategy earned the result.
CAGR, the compound annual growth rate
Tells you how fast the money compounded on average, year after year. It is a useful first look. Among any group of strategies, the ones with higher CAGRs grew the money faster. What CAGR cannot tell you is how rough the ride was on the way there. Two strategies with the same CAGR can put you through wildly different experiences, and that matters because most of us cannot stay invested through a ride that hurts too much. That is what the next number measures.
The Sharpe ratio captures how rough the ride was for the growth you earned.
It looks at every wobble in the portfolio’s value, up or down, and asks how much return came out for each unit of risk. A higher Sharpe means a steadier climb. Anything above 1.0 is good, and anything above 1.5 is rare. Sharpe has one real weakness. It treats every wobble the same, including the good ones. A day the portfolio jumps unexpectedly upward counts against your Sharpe the same way a day it falls does. But we do not mind upside surprises. They are the whole point. The number we would rather know is one that only counts the wobbles that hurt.
The Sortino ratio is that number. It only counts the days the line went red, ignoring the days it surprised on the upside.
A high Sortino means you are earning your growth without paying for it in fear. Above 2.0 over a full market cycle is hard to do.
Over the same six years, the S&P 500 ran at Sharpe 0.81 and Sortino 1.15. Lionshare ran at Sharpe 1.69 and Sortino 2.71, more than twice as smooth, and more than twice as efficient at turning risk into return that arrived. The growth rate is not borrowed against bigger risk. It is paid for cleanly.
How the win rate grows with time
Behind those headline numbers is a pattern that says more about how the strategy works than the numbers themselves do. It is the win rate by holding period.
Pick a single day in the backtest at random and the strategy was up about 55% of the time. That is barely better than a coin flip, and it is supposed to be. Day to day, the line jumps around.
Pick a month at random and the win rate climbs to 66%. Two thirds of all months were positive.
Pick a quarter and it climbs again, to 81%. Four out of five quarters ended in the green.
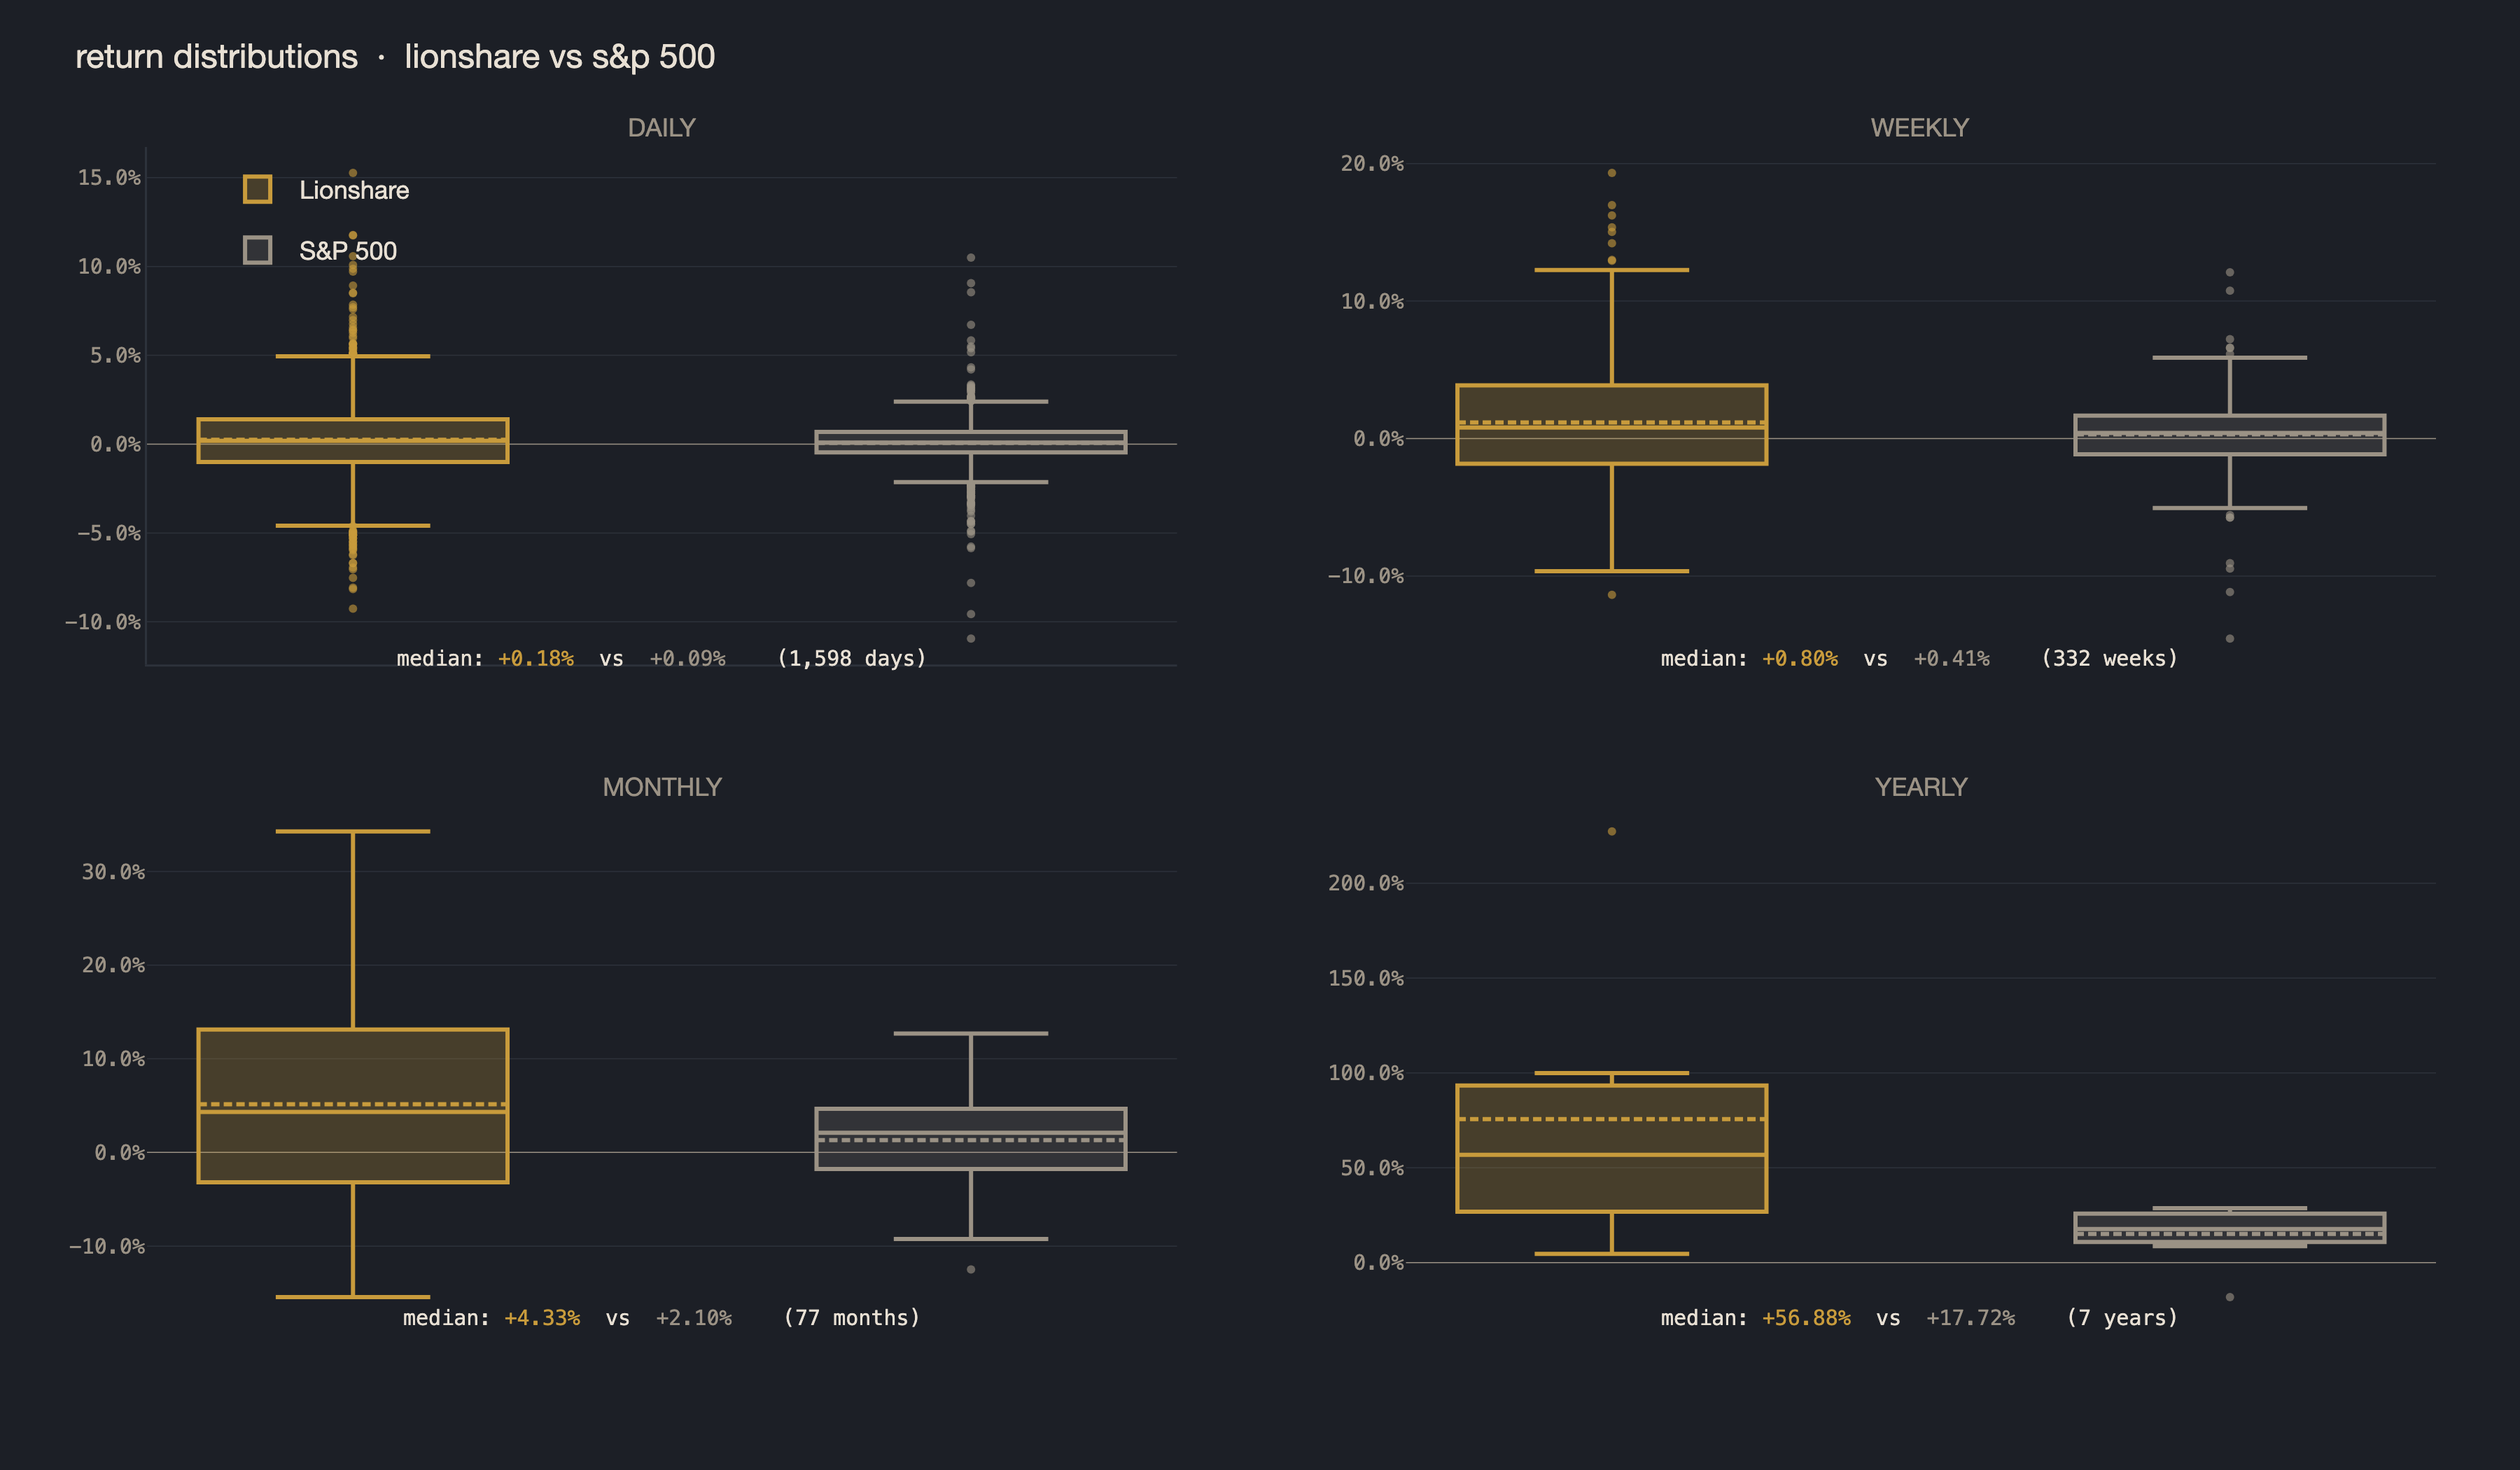
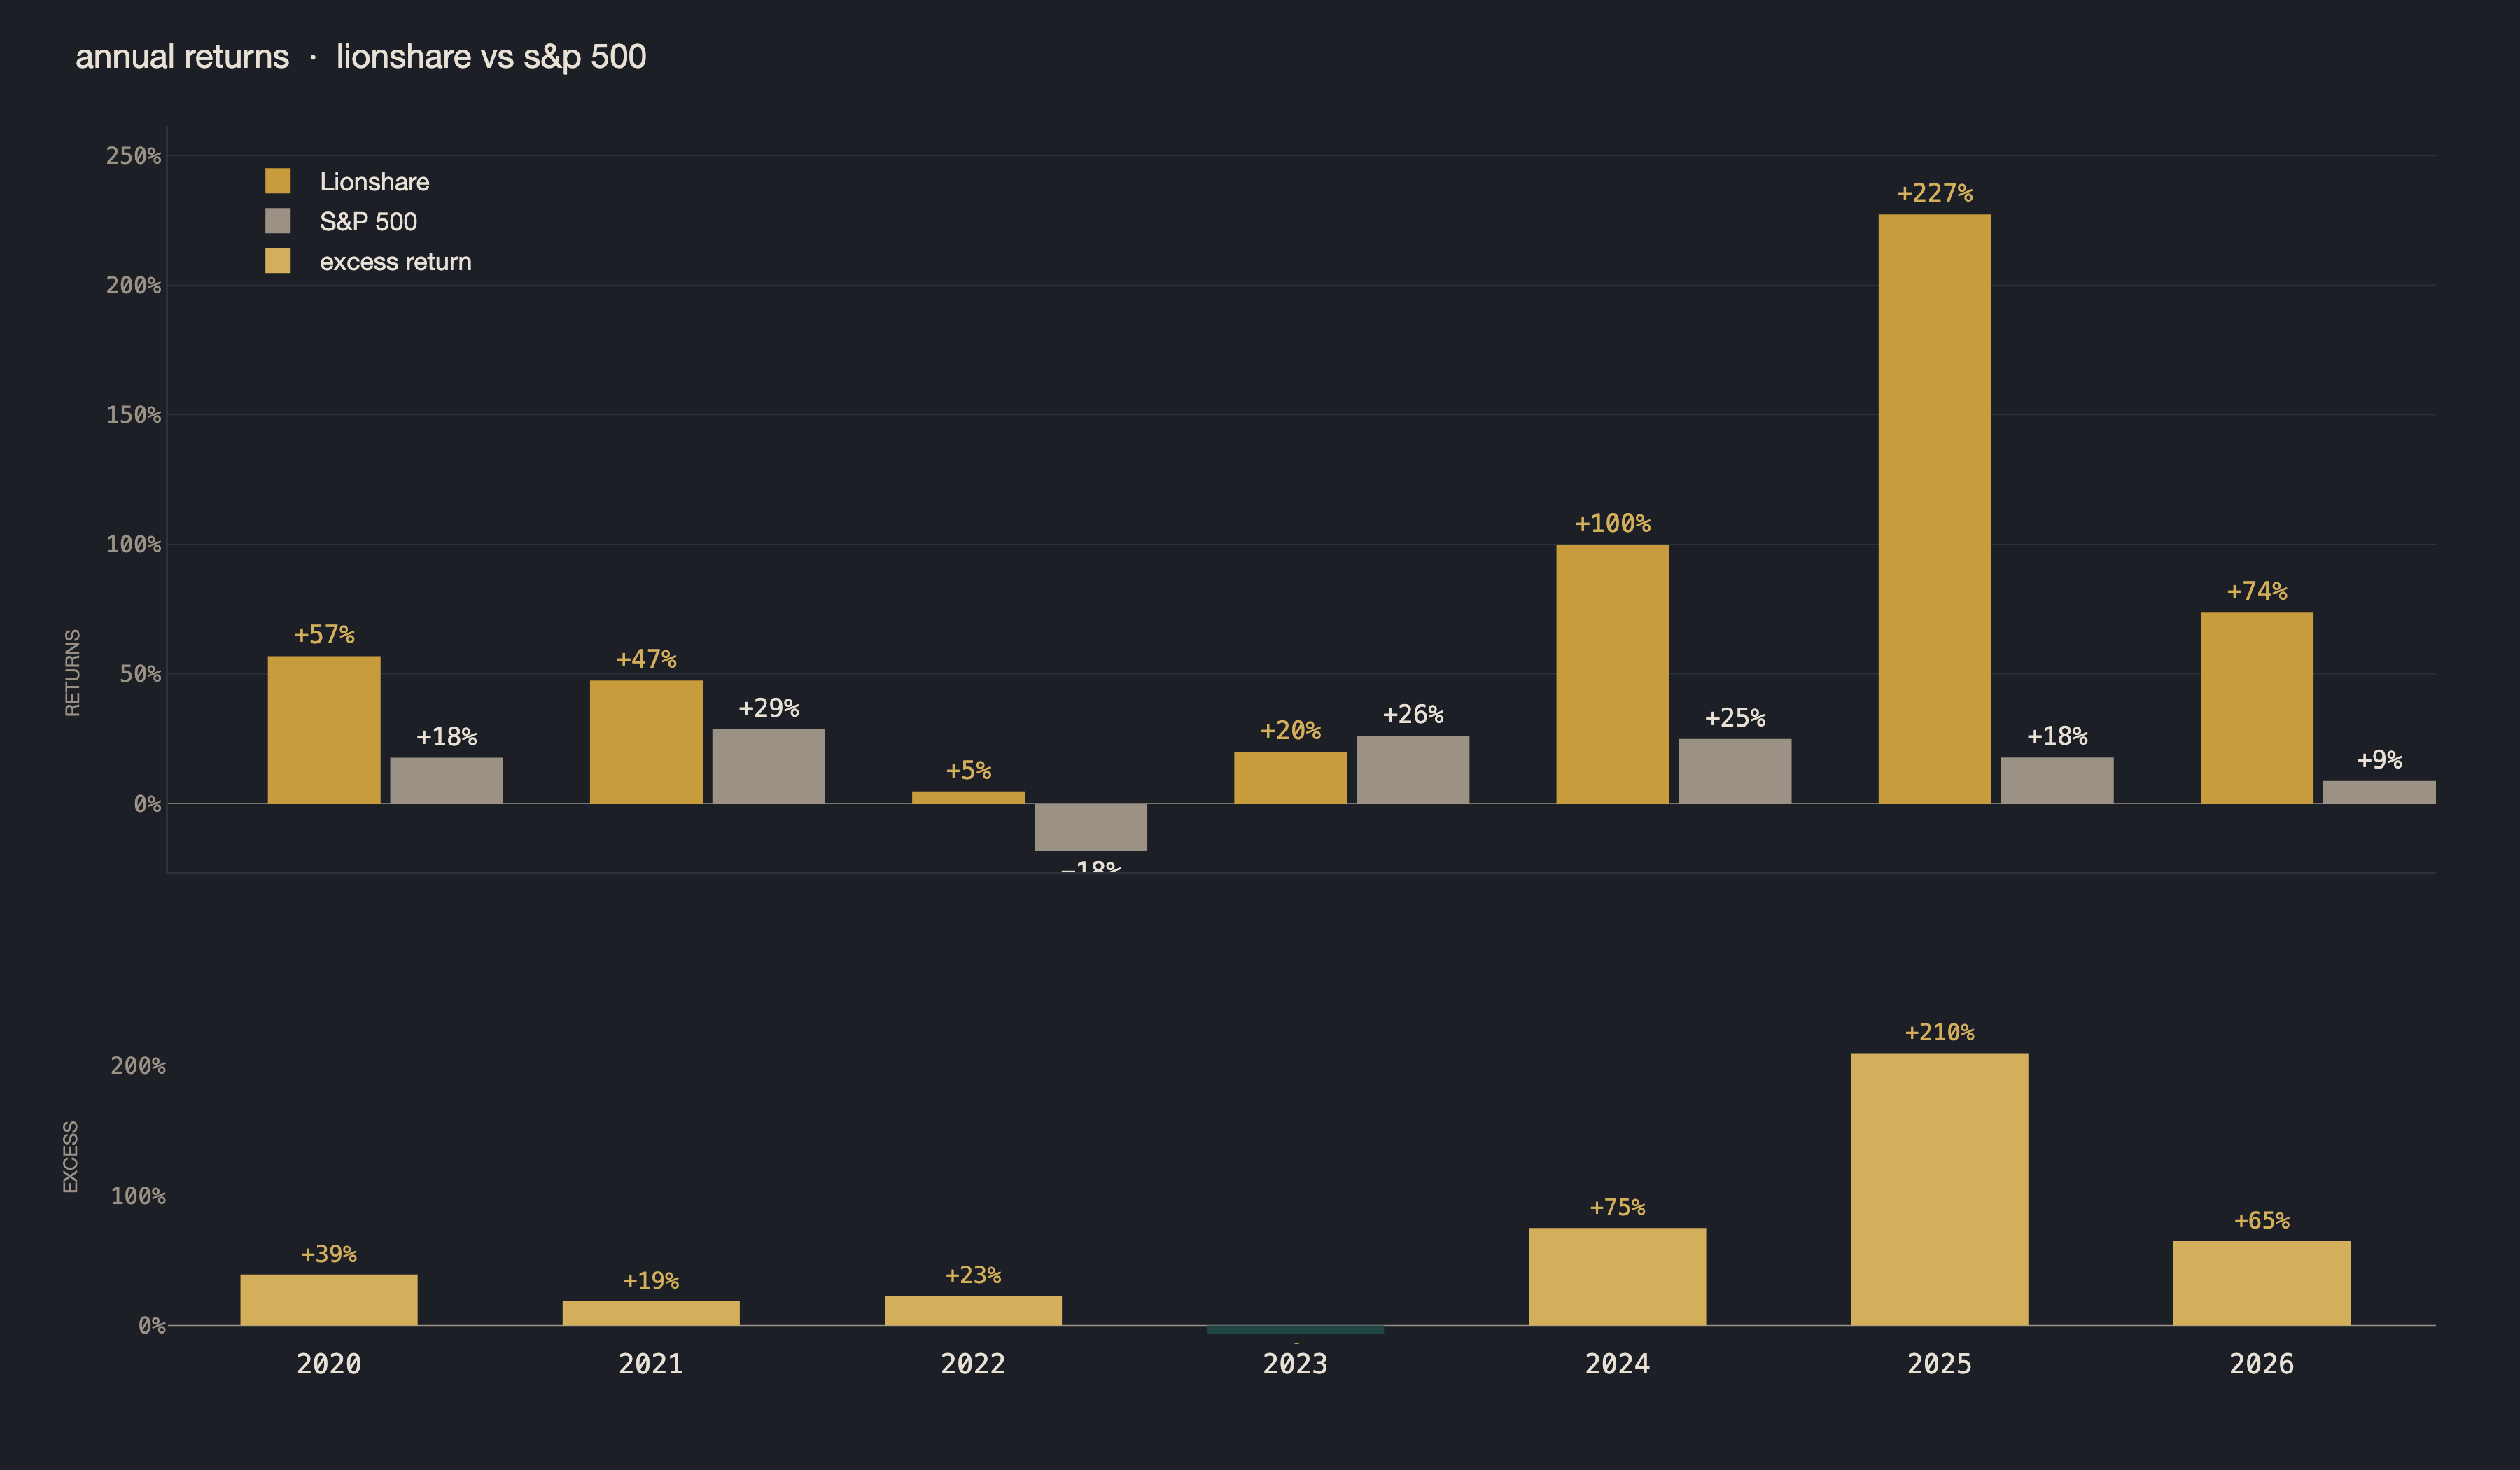
Pick a full calendar year and the win rate is 100%. Every single year in the backtest, the strategy made money. Even 2022, when the S&P 500 fell 18%.
The pattern is the point. Day to day, this strategy looks noisy and close to random. The longer you hold it, the more the noise averages out and the underlying edge shows up. That is exactly what you want from a system you check once a week and forget about for the other six days.
It is also why the thirty-minutes-a-week design is not just a lifestyle choice. It is structural. Checking this strategy more often does not give you better information. It gives you noise without signal.
Where the money moves
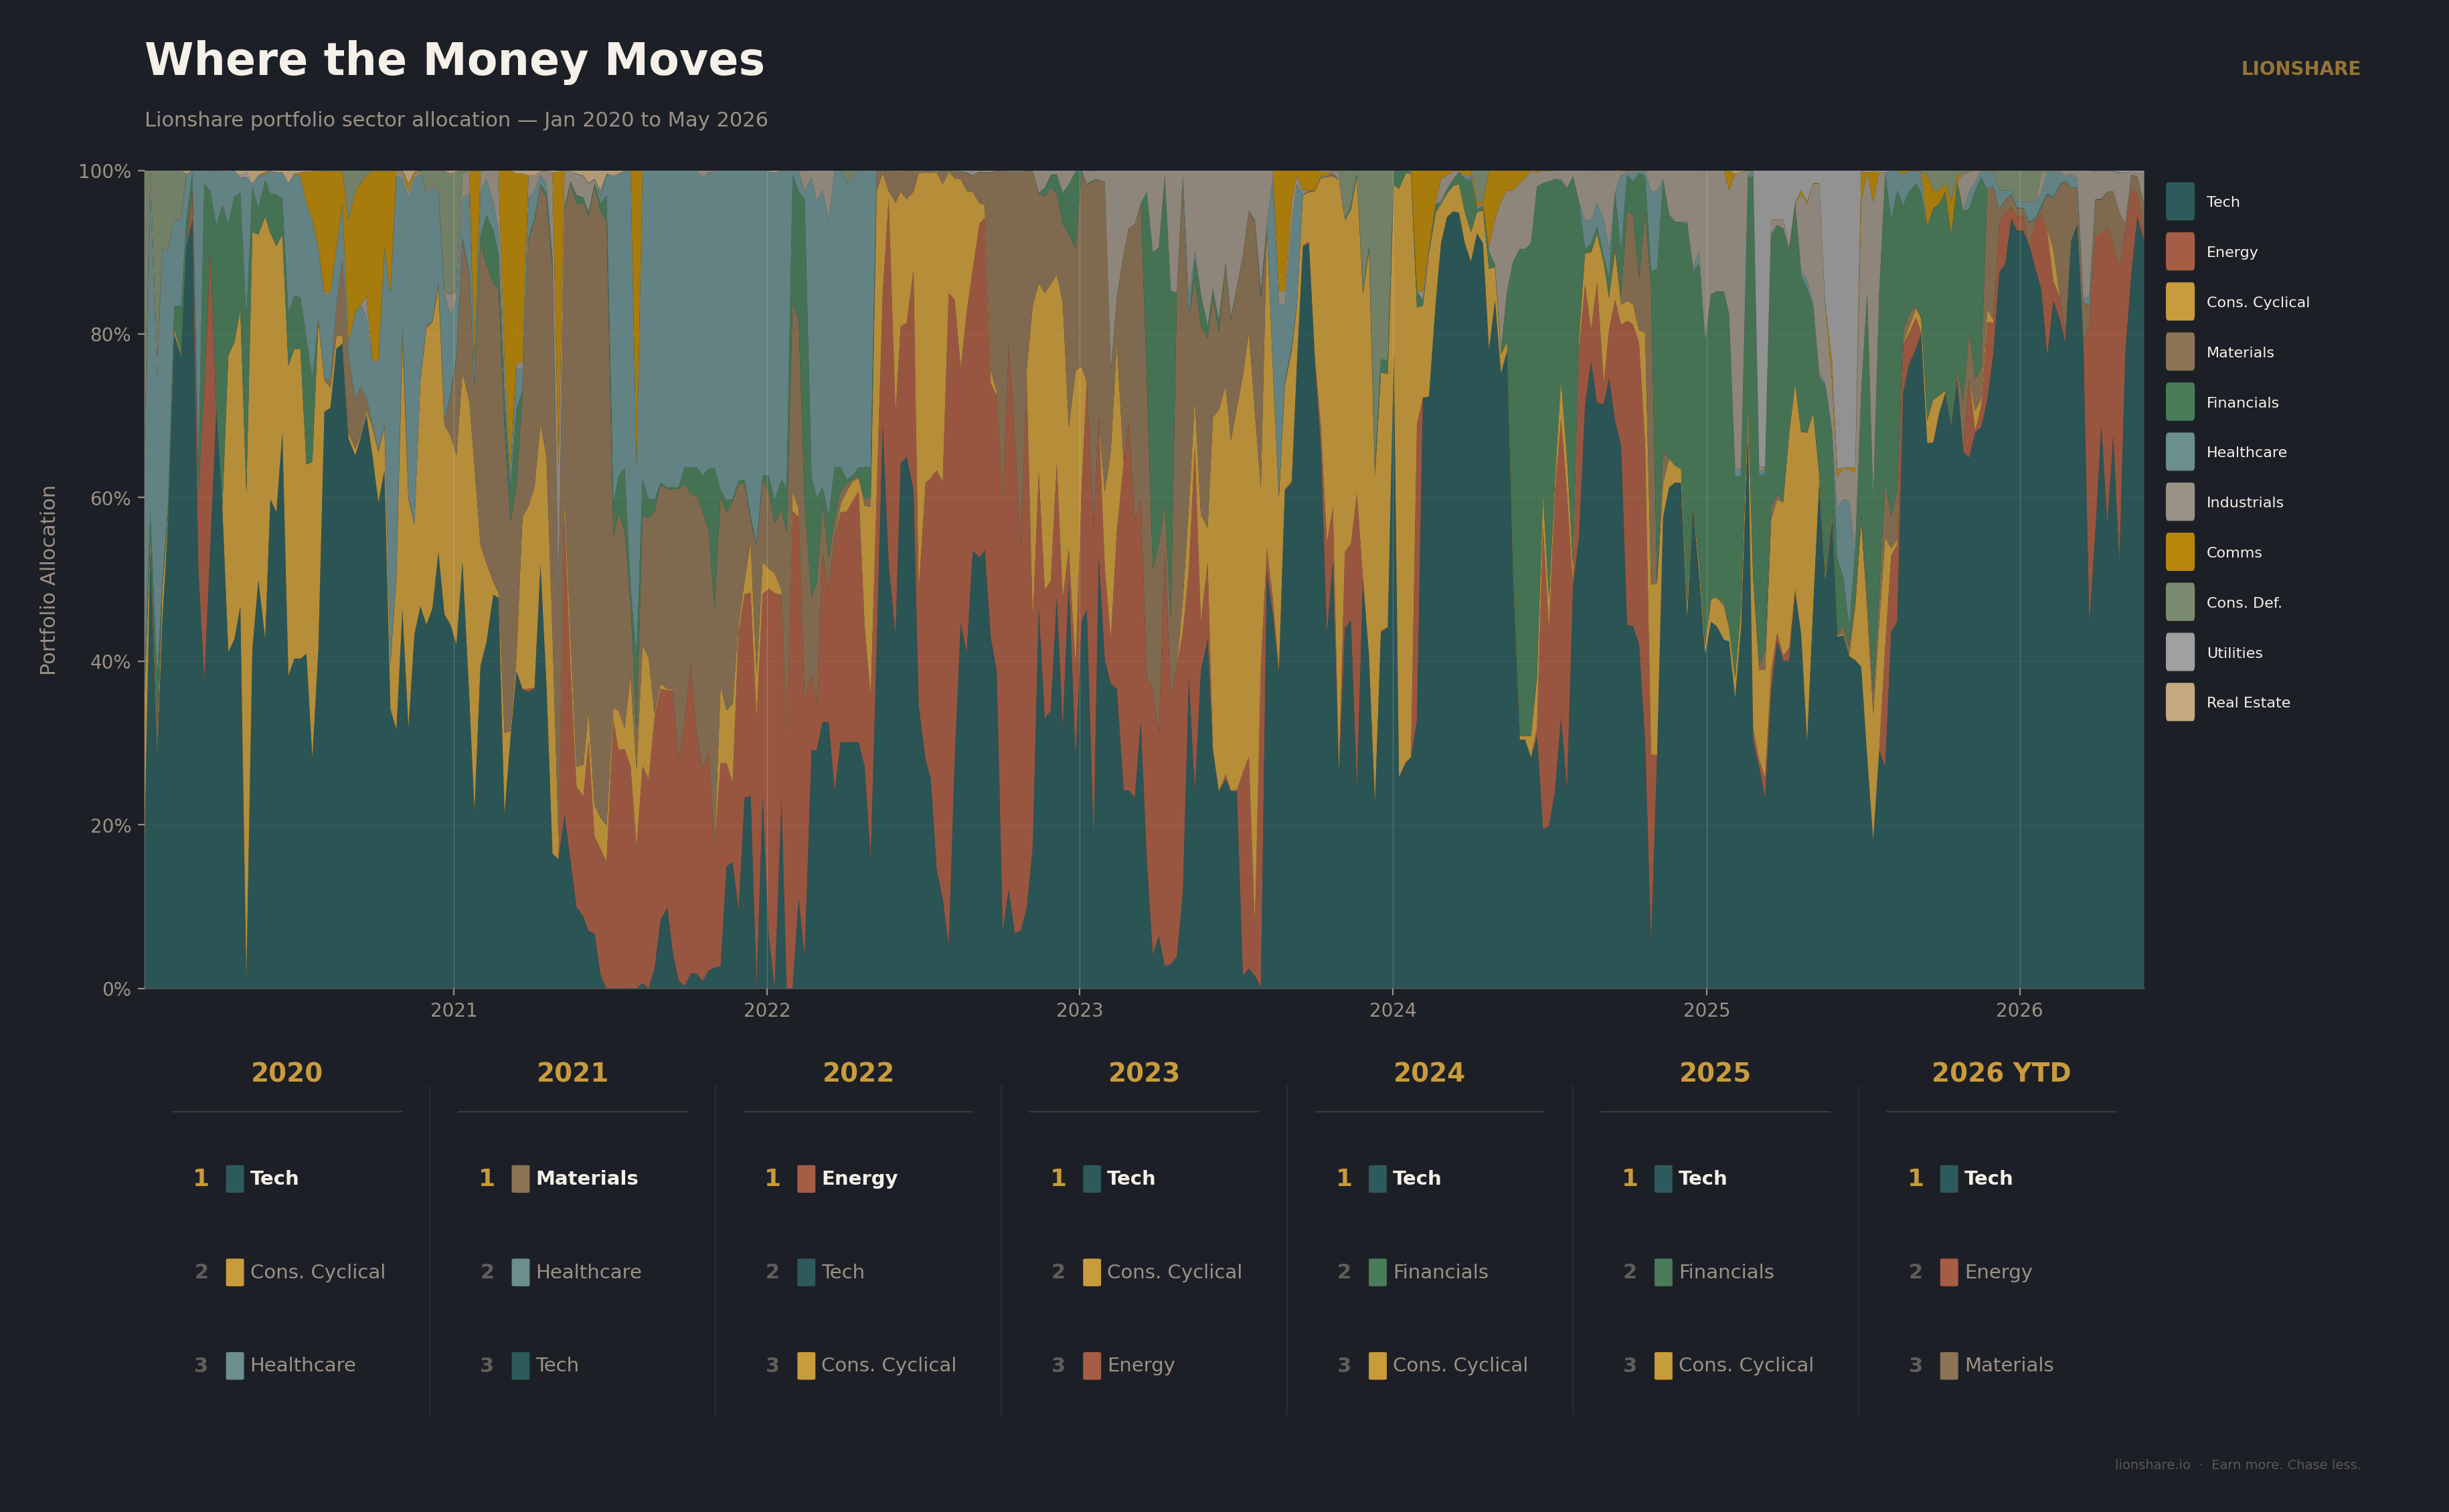
Every Monday the system scores the same two thousand or so stocks and puts the money where the scores are highest. It isn’t tied to a sector, a theme, or last year’s winners. If the best companies this week are spread across five corners of the market, that’s where the money goes. If they’re concentrated in one, the money goes there instead.
This chart shows where it has gone since January 2020.
Technology has been the largest holding on average, around 43% of the portfolio, because for most of these six years the highest-scoring companies have been tech companies. But that share has swung a long way. In 2022 the largest sector was energy, near 32% for the year, and the portfolio looked almost nothing like it had twelve months earlier. By early 2024 technology was back near 95%, after sitting around 36% the previous summer.
The year-by-year leaders make the movement plain. Materials and healthcare led in 2021, with tech in third. Energy led in 2022. Tech’s share then climbed across the next three years, from roughly 35% to 78% so far this year. Across the full window the portfolio has held all eleven sectors at one point or another.
A strategy that only works when the market is rising is really just a bet on the market. This one moves. It has no sector targets and no interest in looking balanced, and every week it follows the evidence to wherever the returns are.
Does the edge survive at size
A strategy that only works on small money is barely a strategy. So before I trusted this with anything real, I tested the opposite. I forced the system to own only more and more liquid stocks, step by step, and ran the full six-year backtest at each setting to read off the largest fund each one could support before its own trading started moving prices.
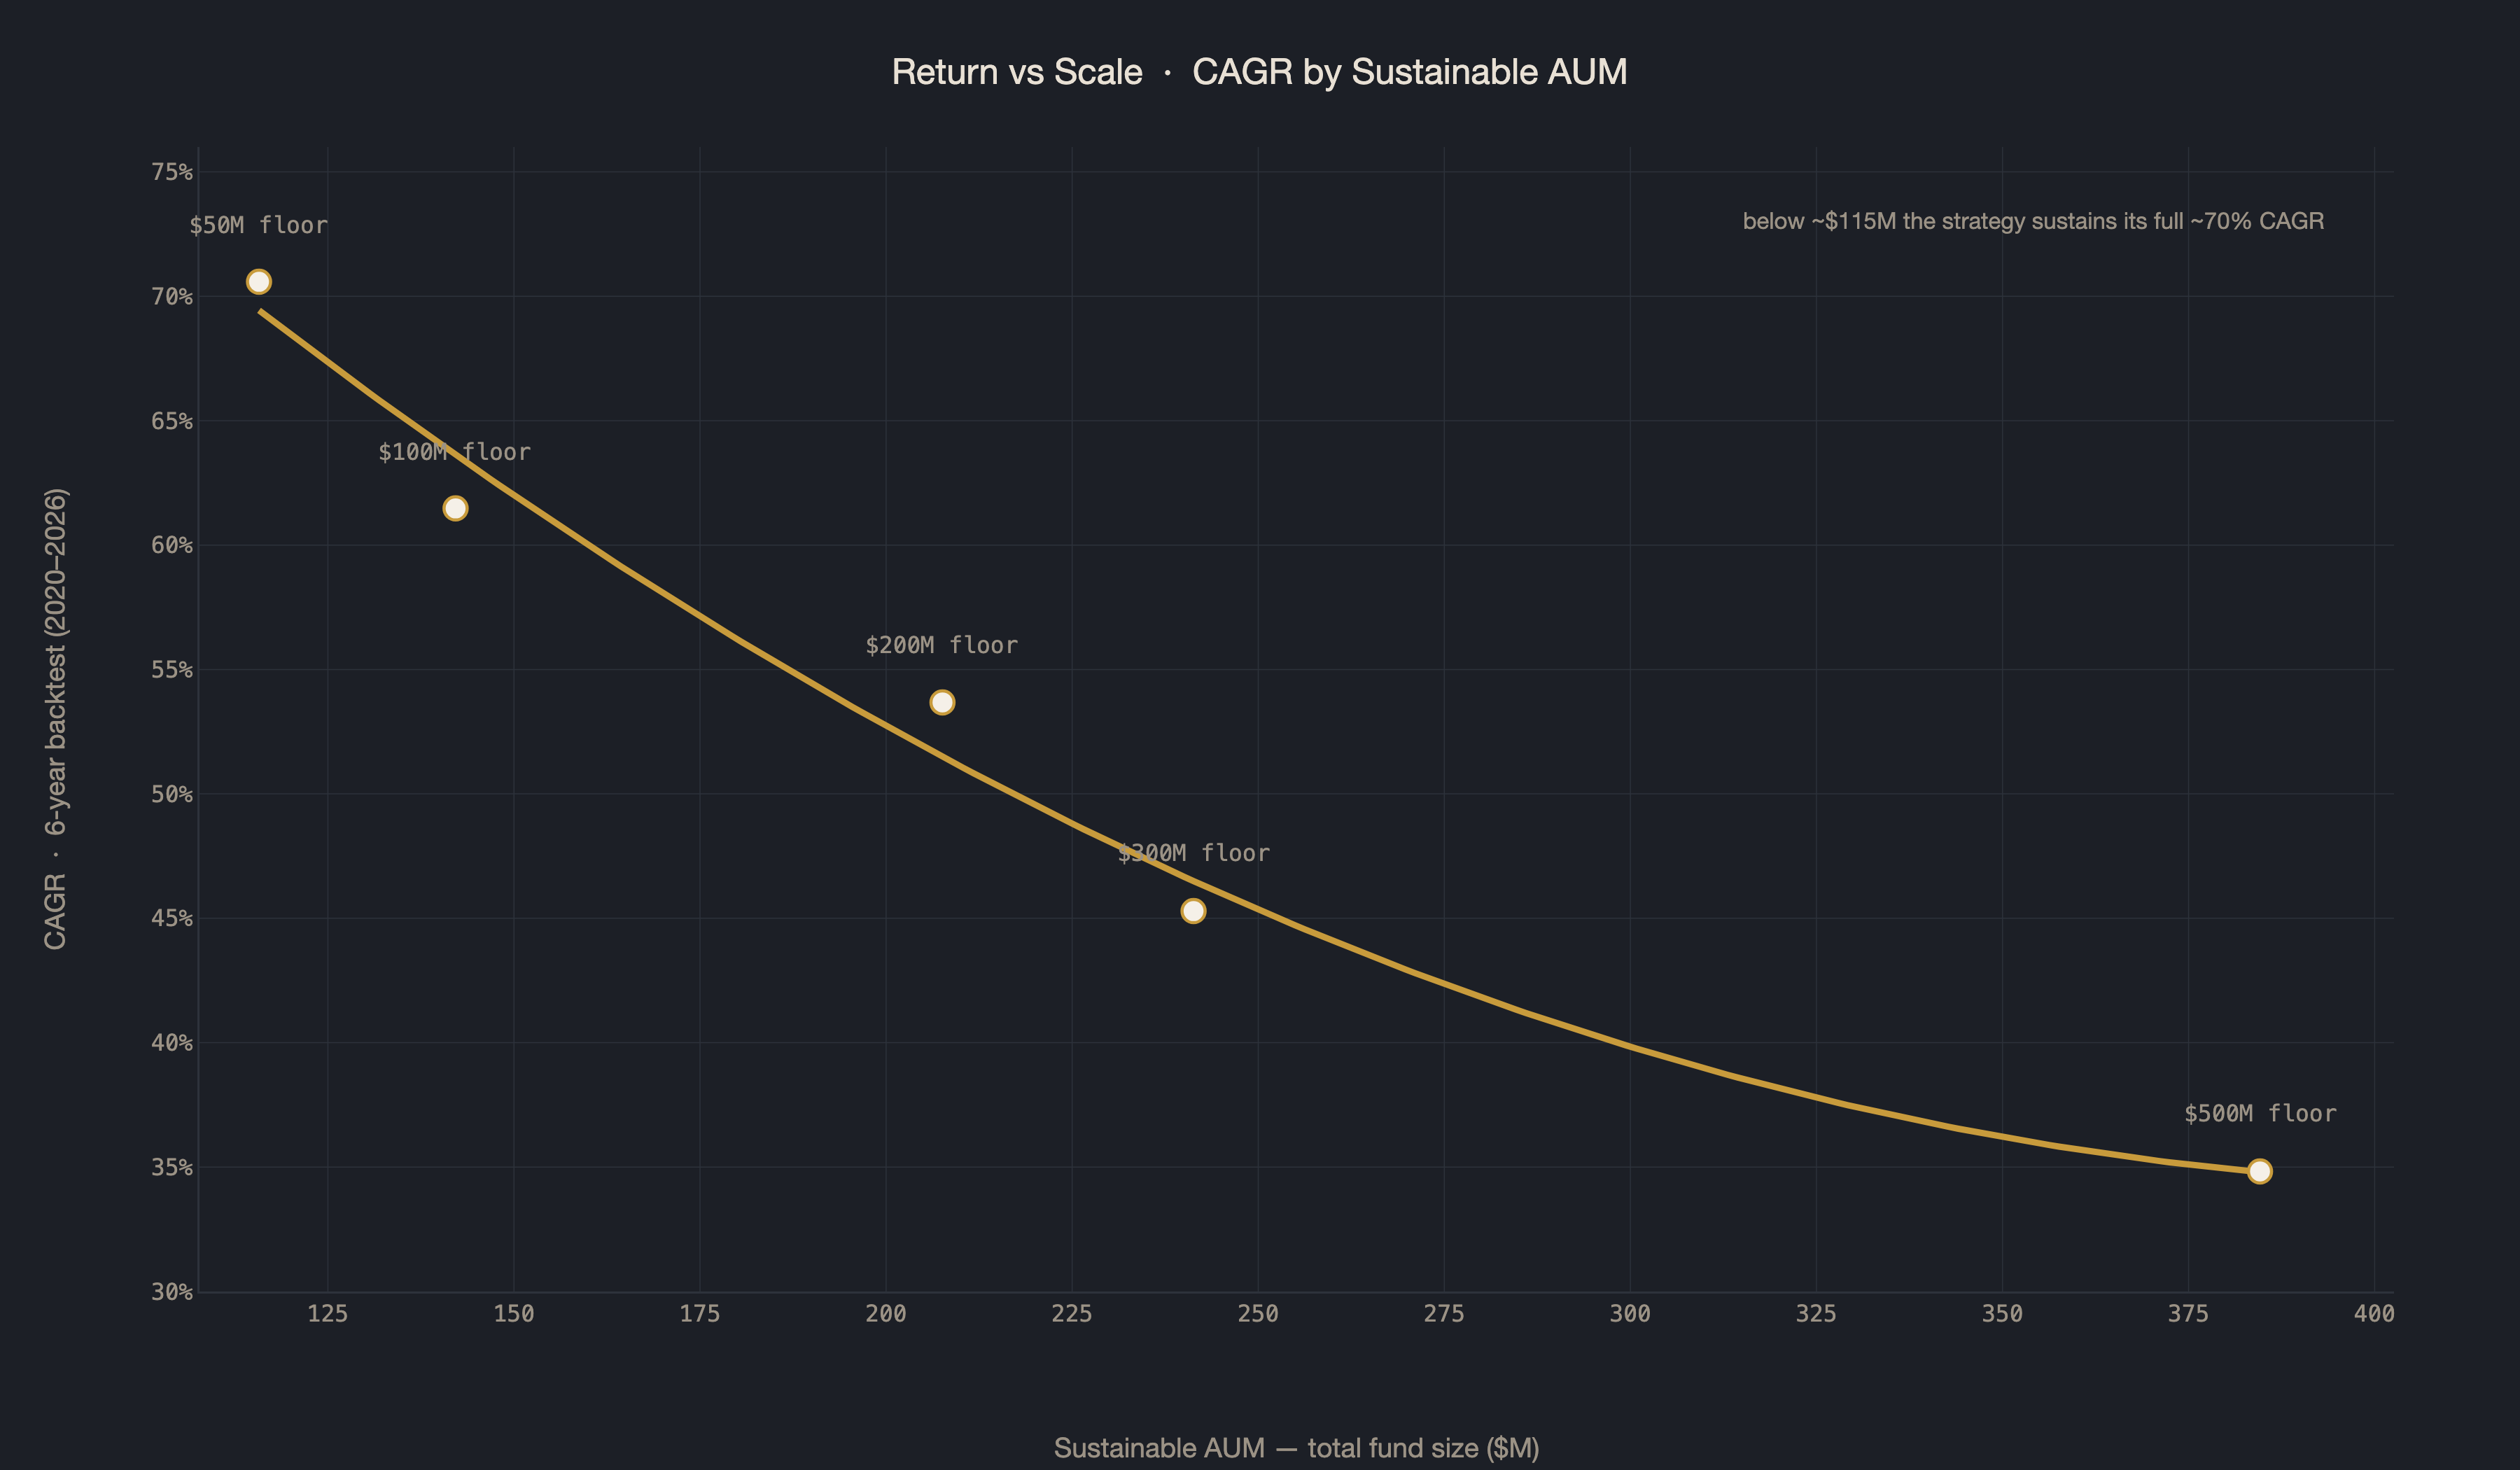
The full return holds flat up to around $120 million, then eases at a steady, predictable rate with no cliff, and the risk-adjusted return stays above the S&P 500 at every size tested. The point is not the ceiling. It is that the edge is not a small-money accident. It holds up far past the size this is built for, and a quirk that only worked on pocket change would not.
The worst stretch. 2022’s drawdown and 2023’s lag
The most important parts of any test are the parts where the strategy lost money or fell behind. Showing only the best years would tell you almost nothing about what kind of system this is. So here are the two stretches that hurt.
The deepest drawdown in the backtest was -33.6%, starting in March 2022 and bottoming in July 2022, during the same broad sell-off that hit everything. It took until February 2023 to fully recover. That is 321 days underwater, and it is a real number to sit with.
The S&P 500’s deepest drawdown over the same window was almost identical at -33.7%, arriving in 2020 under a different kind of pressure. The maximum pain is roughly the same. The difference is what happened around it.
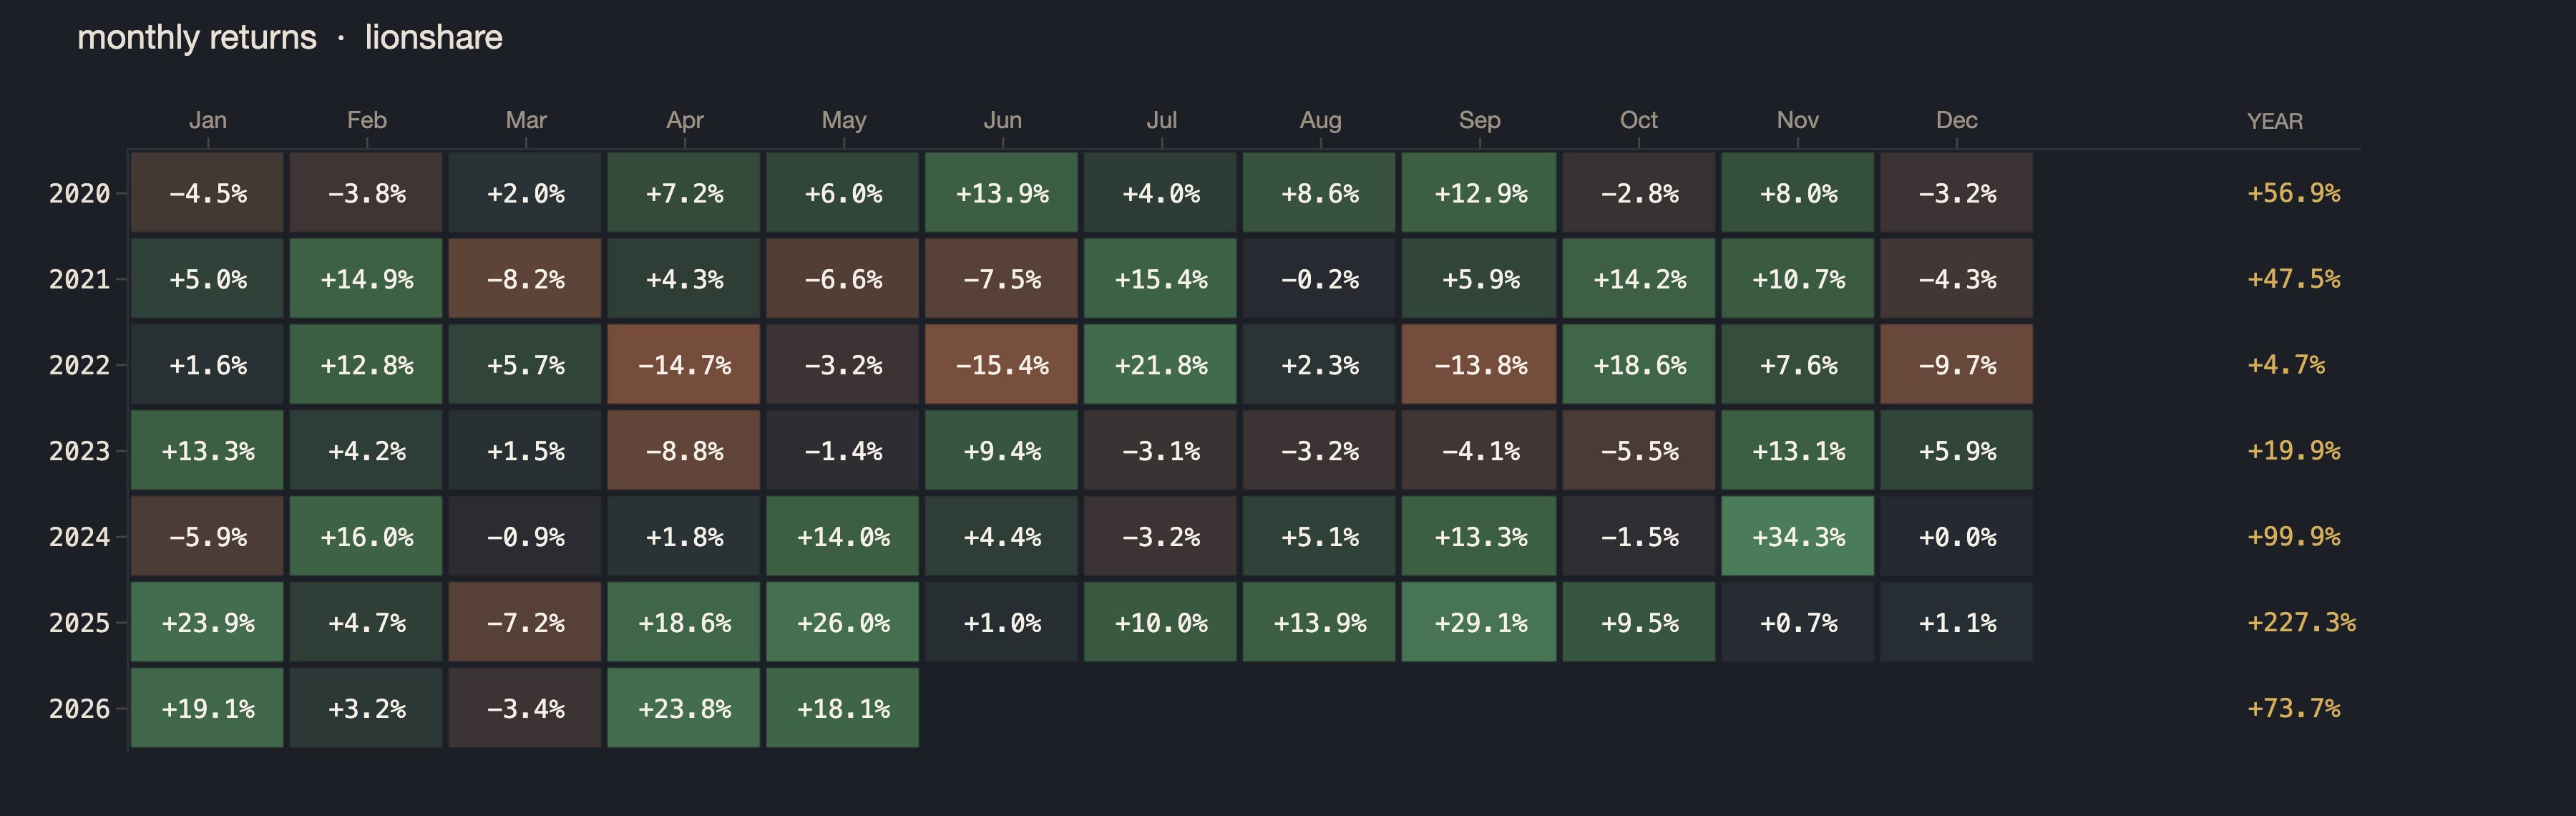
Even through that drawdown, 2022 still ended positive for Lionshare at +4.65%. The S&P 500 finished that year at -18.18%. The system took the hit mid-year, recovered, and still closed green while the market closed deep in the red.
Then 2023, the one year the strategy underperformed. The S&P 500 was up 26%. Lionshare was up 20%. Nothing broke. The market simply ran in a direction that did not suit what the strategy favors most, the way it does in a year when a narrow handful of names drag the whole index up. That happens, and it will happen again.
Here is the mental model for all of it.
The system is built to chase growth. In years the market rewards growth, it outperforms by a wide margin. When the market is punishing nearly everything, it still takes the hit, it just recovers faster and ends better. And in years a narrow set of stocks drives the entire index, it can lag behind.
One last number ties the drawdown to the return. The Calmar ratio measures growth earned per unit of worst-case loss, how much you made for the deepest hole you sat through. The market’s Calmar over this window was 0.46. Lionshare’s was 2.17. Per unit of worst-case pain, Lionshare delivered roughly five times what the market did.
How I validated the backtest
I built a system that, on paper, beat the market by a wide margin. So has nearly everyone who has ever built one, and almost all of them were wrong. A beautiful backtest is the easiest thing in the world to produce, and to fool yourself with. So the real work was never the result. It was three separate ways of trying to prove the result was a lie, and watching it survive all three.
Layer one. I start by assuming it is wrong.
My default position about my own work is that it is broken until I cannot break it.
I always start from the view that the system is wrong, and that any good result is probably a look-ahead bug or some other innocent error. Then I try to prove exactly that. Whatever survives the attempt, I begin to trust
There is one specific mistake that ruins most backtests you have ever heard about. It has a name, look-ahead bias, and it is exactly what it sounds like. The test accidentally lets the system see something it could not have known at the time. Earnings that landed after the close, treated as if they were available before it. Companies that went bankrupt later, quietly dropped from the history. Small leaks like that produce enormous, fake-looking results.
So every part of the system gets the same treatment. Each rule, each data source, each step gets pulled apart and checked for a leak or a bug, then refined and checked again. From September through December of 2025, before a cent went live, I did little else. I found things. I fixed them. I trusted what was left standing.
Layer two. A backtest is only a model, so I run it live where I cannot edit it.
There is an old line among statisticians. All models are wrong, some are useful. A backtest is a model of the past, and no amount of care turns it into the real thing. The only way to know is to run it forward, in public, on a record I cannot rewrite when it disappoints me.
On January 12th, 2026, I went live on a copy-trading platform called Dub. Dub is a deliberate choice, and not a flattering one to me. It does not let me set intraday safety lines or precise orders, I update it by hand, and it charges fees. Every one of those makes the Dub version of Lionshare worse than the one in my own brokerage account. I went live on it anyway, for one reason.
Dub is public. Anyone can look. It shows the returns since inception, it is stamped in time, and I cannot alter it. The only way to show a good record there is to have one.
If the live results keep tracking the simulation, week after week, the simulation stops being a claim and starts becoming proof. A few months is still early, and I will say so plainly for as long as it is true. But so far the live record is tracking the test, and that is the most encouraging evidence there is. Year to date it has more than doubled while the market has been roughly flat. The number is not the point. The point is that you do not have to take my word for it.
Layer three. A frozen record that makes look-ahead bias impossible.
This is the part I am most proud of, and it is the kind of rigor almost nobody builds, because almost nobody plans to run someone else’s money at scale.
Before I went live I asked a different question than most people ask. Not whether this was good enough for the small amount I was starting with, but this.
What would the system have to be built on for me to comfortably reinvest a million dollars into it, every single week?
I built for that version, not the one I have today. So every Monday morning since January 2026, before the system makes a single decision, it saves a permanent snapshot of the exact data it could see that morning. Frozen the instant it lands, stamped, and never touched again.
Week by week, that builds something rare. A point-in-time database. A true record of what the market knew at each decision, and nothing it learned afterward. Because each snapshot is sealed the moment it is saved, look-ahead bias becomes impossible rather than merely unlikely. A future fact has no way to leak backward into a decision that was already made and recorded on that day’s data.
It also gives me a check the backtest alone never could. Across the stretch of live trading where I can line all three up against each other, early February to early May 2026, I have run three separate calculations of what Lionshare should have been worth on each of those days. The original backtest from years ago. A fresh reconstruction built only from each day’s frozen snapshot. And the live portfolio that traded on Dub.
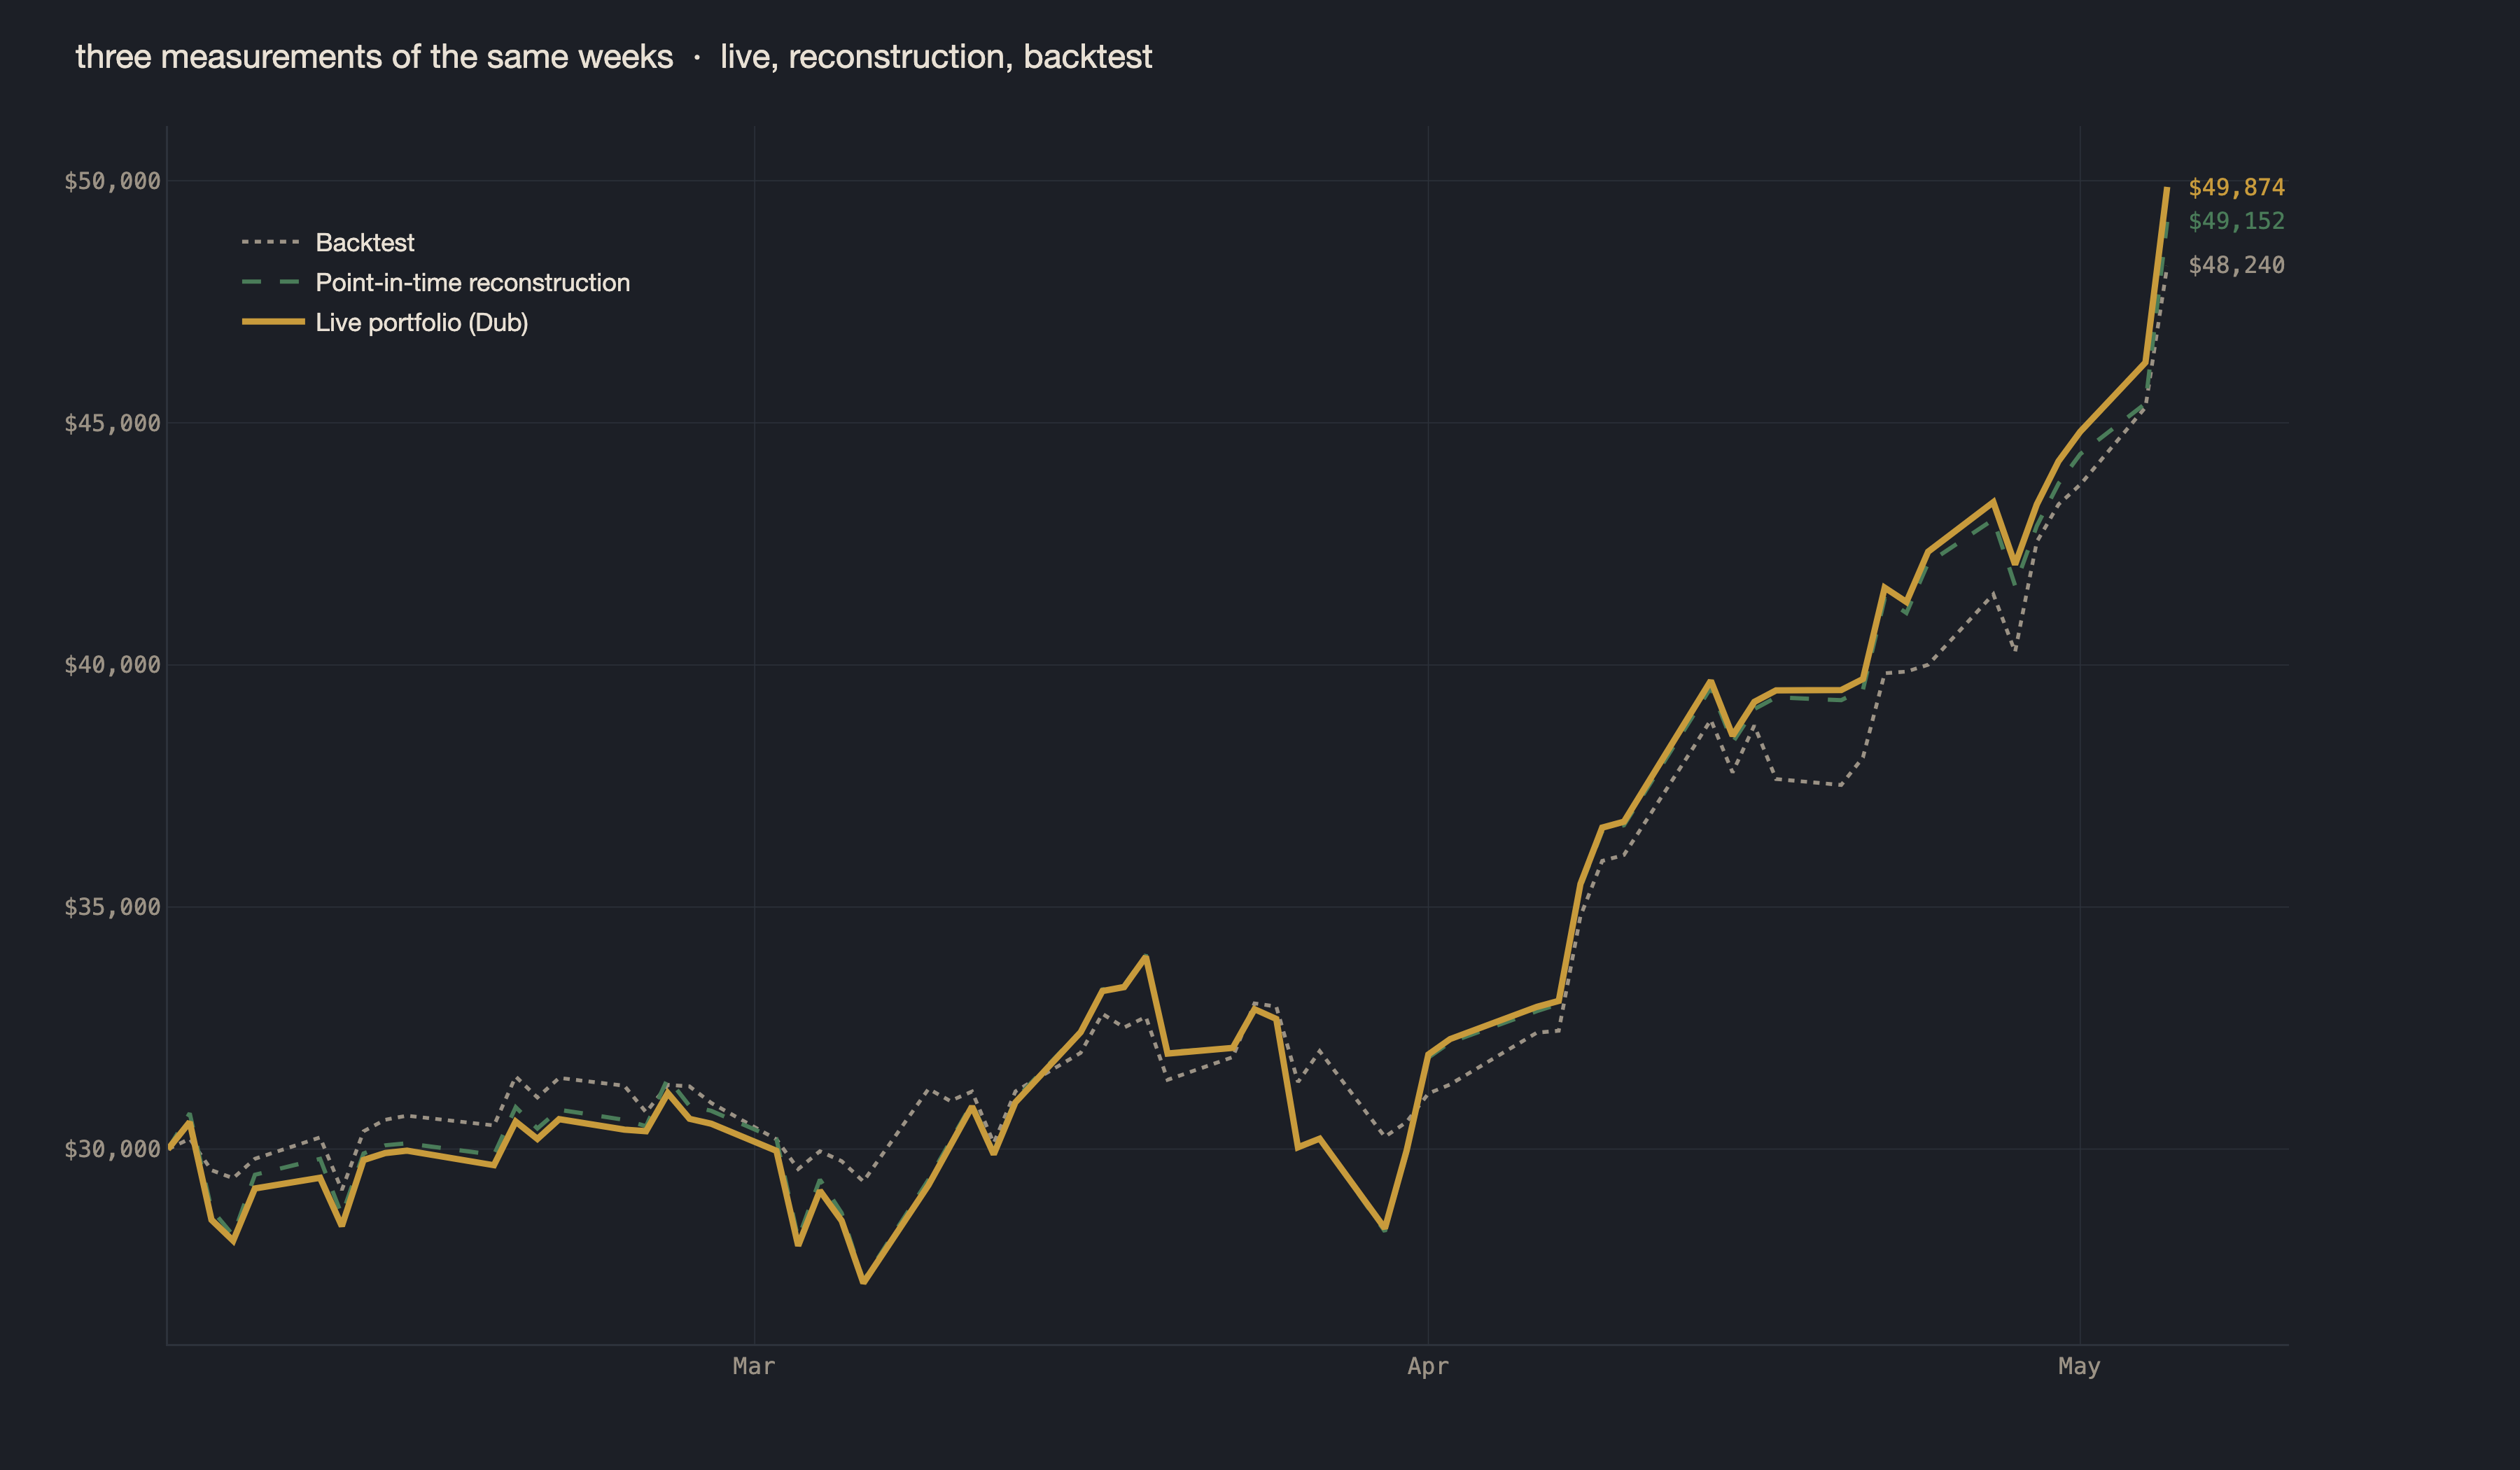
The two I can measure independently, the live record and the point-in-time reconstruction, sit within half a percentage point of each other across the entire window. The original backtest runs right alongside them. The backtest, live, and reconstructed lines don’t always follow to the dollar, but they don’t need to, as we expect simulations to differ and real-world execution to have some impact. The point is that three measurements, built at three different times in three different ways, tell one story.
That agreement is what I needed before trusting this with real money, and it is what keeps me adding to it with every paycheck.
The real limits
Before I close, the limits. Some come from choices I made on purpose. Others are just the truth about investing in markets nobody fully predicts.
The biggest one first. The test cannot prove the future. It shows the strategy held up across six years of real conditions and three independent checks. It does not promise the next six look anything like the last six. Everything below is what I am not claiming, and what I genuinely do not know.
Past performance does not guarantee future returns. That is true of every strategy in every market, including this one.
The strategy can and does fall behind. In 2023 the S&P 500 was up 26% and I was up 20%. Nothing broke, the market just ran in a direction the system does not favor, and that will happen again. There can be stretches, maybe long ones, where a plain index fund does better.
The drawdowns are real, and the next one could be deeper. The worst in six years took about a third off the portfolio before it recovered. A future one could take more. The portfolio is concentrated, around twenty names, which is part of why it climbs fast and part of why it falls hard. If watching a third of your account go red on the way to making it back several times over would end the experiment for you, this is the wrong strategy for you, and I would rather you know that now than later.
There is no AI making the picks. I use AI constantly to improve and check the system around the edges, but no AI makes a single decision in the portfolio. The reason is the same as everything else here. I cannot rigorously test an AI’s choices, and I cannot promise its judgment stays steady from one month to the next. So the decisions stay with rules I can test, and AI stays where I can audit it.
What I wanted from a strategy in the first place
I did not start by asking what the best strategy was. I started with a different question. What life do I want, and what kind of portfolio pays for it?
Three answers came back, and they became the bar everything above was measured against.
Thirty minutes a week, and not a minute more. No screens, no charts, no checking prices on my phone. If running this ever cost me more than half an hour on a Monday, it would have failed at its real job, which is to grow money and give me back my time, not take more of it.
It has to beat the market by enough to be worth it. Not by a sliver. An index fund is the thing I am trying to outgrow, so beating it by a point or two is not worth the effort. If it cannot meaningfully outrun a plain S&P 500 fund over a full cycle, there is no reason to run it at all.
It has to hold up at size. Today I run it with a slice of my own savings. I want to run it with a million one day, and more after that. Anything that only works for one quarter, or one bull run, or one market mood is luck, not a strategy. It had to survive calm markets and ugly ones, small money and large.
Everything you just read, the returns, the drawdown, the win rates, the capacity test, the three layers of checking, is me holding the system against those three tests and reporting what I found.
The backtest is the case for the strategy. The live record is where it has to keep proving itself, in the open, with my own money, every Monday. That record is on Dub, it started before any subscriber existed, and you can read every week of it before you trust a word I have written here.